
- Title
-
Glypican 4 regulates planar cell polarity of endoderm cells by controlling the localization of Cadherin 2
- Authors
- Balaraju, A.K., Hu, B., Rodriguez, J.J., Murry, M., Lin, F.
- Source
- Full text @ Development
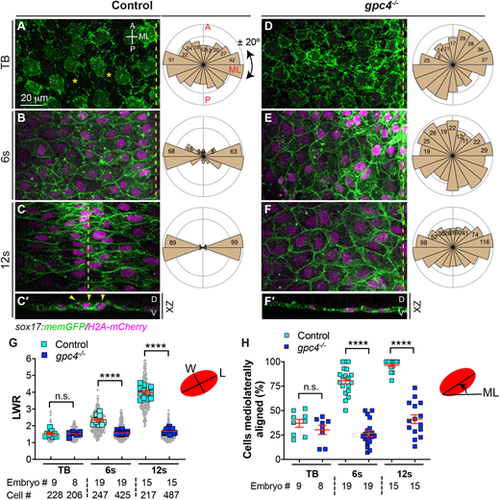
Gpc4 is required for endodermal cell polarity during segmentation. (A-F′) Confocal images showing endodermal cells with plasma membrane (GFP) and nuclei (pseudo-colored magenta) labeled in the indicated embryos at the tailbud (TB), 6s and 12s stages. (A-F) Z-projection of XY view; (C′,F′) Z-projection of XZ view. Asterisks indicate gaps between cells; dashed-yellow lines indicate the midline. A, anterior; D, dorsal; ML, mediolateral; P, posterior; V, ventral. Rose plots illustrate the cell orientation in indicated embryos (each bin, 20°). (G) Average length-to-width ratio (LWR) of endodermal cells in embryos in A-F. Data from all embryos (squares) and all cells (gray circles) are superimposed, with the number of cells and embryos indicated. (H) Percentage of cells the longitudinal axis of which was oriented ±20° with respect to the ML embryonic axis in embryos in A-F. Data are mean±s.e.m. n.s., not significant, P>0.05, ****P<0.0001 (unpaired, two-tailed Student's t-test). |
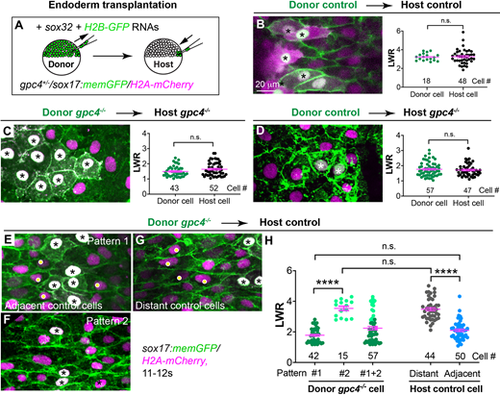
Gpc4 is required in a cell-autonomous and non-cell-autonomous manner for planar polarity of endodermal cells. (A) Schematic illustrating endoderm transplantation in embryos obtained from incrossing gpc4+/−/sox17:memGFP/H2A-mCherry zebrafish. (B-G) XY view confocal images (Z-projection) showing endoderm in the indicated host embryos transplanted with the indicated donor endoderm cells (the nuclei of which are white, indicated by asterisks). Graphs show average LWR of host (green) and donor (black) endodermal cells at the 12s stage of control donor cells transplanted into sibling control hosts (B, four embryos); gpc4−/− donor cells transplanted into gpc4−/− hosts (C, five embryos); and control donor cells transplanted into gpc4−/− hosts (D, three embryos). (E-G) XY view confocal images (Z-projection) showing endodermal cells displaying different patterns in control hosts transplanted with gpc4−/− cells (nine embryos). Yellow dots show control host cells. (H) Average LWR of host and donor endodermal cells at the 12s stage. All cells analyzed are plotted and the number of cells is shown. Dark green dots, pattern 1 donor cells; light green dots, pattern 2 donor cells; grey dots, distant host cells; blue dots, host cells adjacent to donor cells. Data are mean±s.e.m. n.s., not significant, P>0.05; ****P<0.0001 (unpaired, two-tailed Student's t-test). |
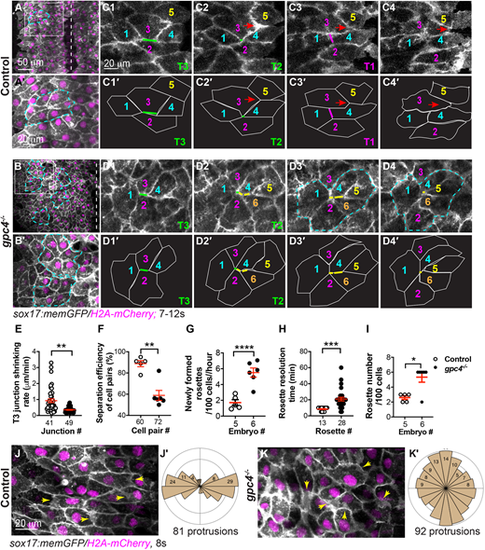
Gpc4 is required for efficient ML intercalation of endodermal cells. (A-D4′) Confocal time-lapse experiments in control (five embryos) and gpc4−/− (six embryos) at the 7s-12s stages using a 20× objective (see Movies 1, 3 and the main text). (A,B) Snapshots from Movies 1 and 3 in the main text showing an overview of one side of the endoderm. Dashed-white lines indicate the midline. (A′,B′) Magnification of region in boxed area in A,B. Dashed-yellow lines indicate rosettes. (C1-D4′) Snapshots from Movies 1 and 3 showing relative positions of some endodermal cells, labeled with the same-colored number over time. Red arrows indicate cells that have squeezed between two neighboring cells; green lines indicate ML junctions (Type 3, T3; C1,C1′,D1,D2,D1′,D2′) shrunk to form a common vertex (Type 2, T2; C2,C2′); magenta line indicates new vertical junctions (Type 1, T1; C3,C3′); yellow lines (D2-D4,D2′-D4′) indicate multiple ML junctions contracting to form rosettes (outlined by dashed-cyan lines; D3,D4). (C1′-C4′,D1′-D4′) Outlines of some of the endodermal cells in C1-C4 and D1-D4 (white lines). (E-H) Quantification of cell behaviors, as represented in C1-C4 and D1-D4. (E) Shrinking rate of the T3 junction (from T3 to T2), with number of junctions analyzed shown. (F) Percentage of cell pairs separated along the AP axis, with number analyzed indicated. (G) Newly formed rosettes per 100 endodermal cells per hour. (H) Resolution time of rosettes formed during the first 60 min of the time-lapse movies (Movies 1, 3), with number analyzed indicated. (H) Total number of rosettes formed per 100 endodermal cells from the 7s-12 s stage. Data are mean±s.e.m. *P<0.05; **P<0.01; ***P<0.001; ****P<0.0001 (unpaired two-tailed Student's t-test). (J-K′) Confocal time-lapse experiments in control (six embryos) and gpc4−/− (six embryos) using a 40× oil objective (see Movies 2 and 4). (J,K) Snapshots from Movies 2 and 4. Yellow arrows indicate cell protrusions. (J′,K′) Rose plots showing orientation of cell protrusions in endodermal cells (bin size, 20°). |
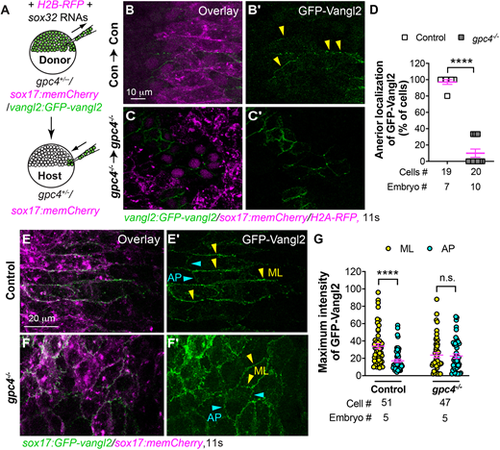
Vangl2 asymmetrical enrichment in endodermal cells is impaired in gpc4−/− embryos. (A) Schematic showing endoderm transplantation. (B-C′) Confocal images showing GFP-Vangl2 distribution in transplanted control endodermal cells in control embryos (B,B′) and transplanted gpc4−/− endodermal cells in gpc4−/− embryos (C,C′). Yellow arrowheads indicate ML boundaries of endodermal cells. (D) Percentage of donor-endodermal cells expressing GFP-Vangl2 at the anterior ML cell boundary in the indicated host embryos. The number of embryos and cells analyzed is indicated. (E-F′) Confocal images showing GFP-Vangl2 localization in endodermal cells in the indicated embryos. Yellow and cyan arrowheads indicate ML and AP boundaries of endodermal cells, respectively. (G) Maximum intensity of GFP-Vangl2 on ML (yellow) and AP (cyan) boundaries of endodermal cells in the indicated embryos. The number of embryos and cells analyzed is indicated. Data are mean±s.e.m. n.s., not significant, P>0.05; ****P<0.0001 (unpaired, two-tailed Student's t-test). |
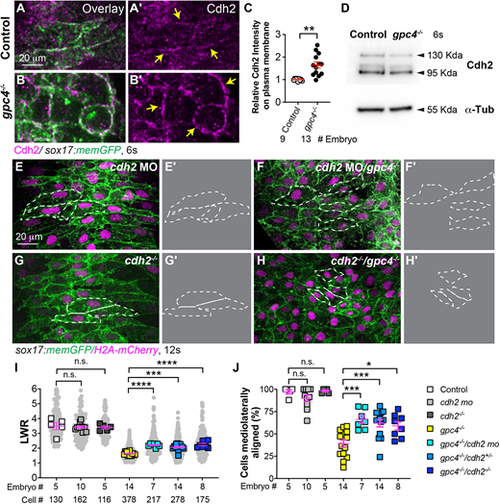
Suppressing Cdh2 expression partially rescues polarity defects in gpc4-deficient endodermal cells. (A-B′) Confocal images (Z-projections) showing expression of Cdh2 (magenta, detected by immunostaining) of endodermal cells of the indicated embryos. (C) Relative intensity of Cdh2 expression on the plasma membrane of endodermal cells (yellow arrows) in embryos in A-B′. The number of embryos analyzed is indicated. **P<0.01 (unpaired, two-tailed Student's t-test). (D) Western blot showing expression of Cdh2 and α-Tubulin (internal control) at the 6s stage (representative of three biological replicates). (E-H′) Confocal images (Z-projections) showing endodermal cells in the embryos indicated. (E′,F′,G′,H′) Outlines of some endodermal cells in E,F,G,H (dashed-white lines). (I) Average length-to-width ratio (LWR) of endodermal cells in E-H. Data from all embryos (squares) and all cells (gray circles) are superimposed, with the number of cells and embryos indicated. (J) Percentage of ML-aligned endodermal cells in E-H. Data are mean±s.e.m. One-way ANOVA followed by a Tukey's multiple comparisons test: n.s., not significant, P>0.05, *P<0.05, ***P<0.001, ****P<0.0001. |
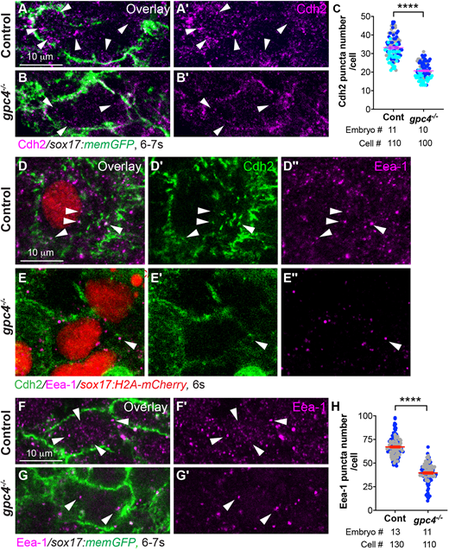
Cdh2 endocytosis of endodermal cells is impaired in gpc4−/− embryos. (A-B′) Confocal images of Z-projections of the indicated embryos (high magnification and resolution) showing Cdh2 expression in endodermal cells, as detected by immunofluorescence. Arrowheads indicate cytoplasmic Cdh2-expressing puncta. (C) Average number of cytoplasmic Cdh2 puncta per cell in the indicated embryos from three experiments, represented by different colors. (D-E″) Confocal images of Z-projections showing the expression of Cdh2 and Eea-1 (detected by immunofluorescence) in endodermal cells from the indicated embryos. White arrowheads indicate Cdh2 and Eea-1 colocalized puncta. (F-G′) Single z-plane confocal images showing Eea-1 expression (detected by immunofluorescence) in endodermal cells from the indicated embryos. White arrowheads indicate Eea-1 expression. (H) Average number of cytoplasmic Eea-1-expressing puncta per cell in the indicated embryos from two separate experiments, represented by different colors. Data are mean±s.e.m. ****P<0.0001 (unpaired, two-tailed Student's t-test). |
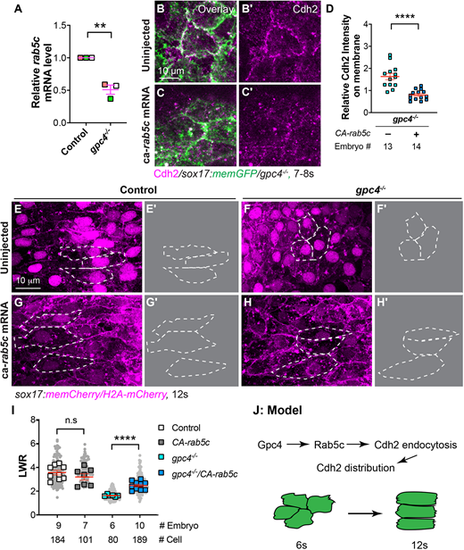
Overexpression of constitutively active rab5c partially rescues defective polarity of endodermal cells in gpc4−/− embryos. (A) Relative mRNA levels of rab5c compared with elf1a in indicated embryos at the 6s stage, as determined by qRT-PCR **P<0.01 (unpaired, two-tailed Student's t-test from three independent experiments, indicated by different colors). (B-C′) Confocal images (Z-projections) showing Cdh2 expression (magenta, detected by immunostaining) of endodermal cells at the 7s-8s stage. (D) Relative fluorescence intensity of Cdh2 expression on the plasma membrane of endodermal cells from embryos in B-C′. (E,F,G,H) Confocal images (Z-projections) showing endodermal cells at the 12s stage. (E′,F′,G′,H′) Outlines of some endodermal cells in E,F,G,H (dashed white lines). (I) Average LWR of embryos in E,F,G,H, with the number of cells and embryos analyzed shown. (J) Model illustrating the mechanism through which Gpc4 controls planar cell polarity of endoderm cells. Data are mean±s.e.m. n.s., not significant, *P>0.05; **P<0.01, ****P<0.0001 (unpaired, two-tailed Student's t-test). |