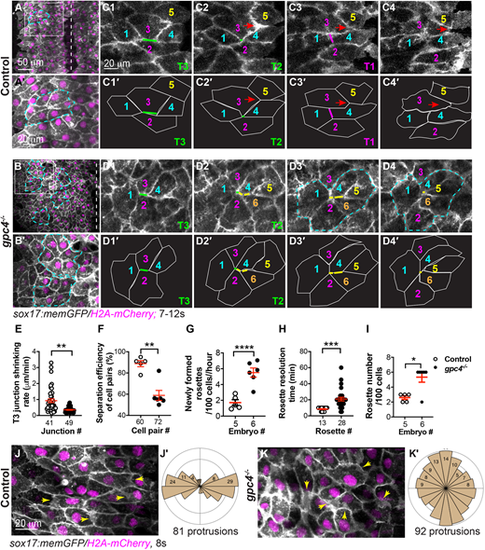
Fig. 3
- ID
- ZDB-FIG-220304-40
- Publication
- Balaraju et al., 2021 - Glypican 4 regulates planar cell polarity of endoderm cells by controlling the localization of Cadherin 2
- Other Figures
- All Figure Page
- Back to All Figure Page
|
Gpc4 is required for efficient ML intercalation of endodermal cells. (A-D4′) Confocal time-lapse experiments in control (five embryos) and gpc4−/− (six embryos) at the 7s-12s stages using a 20× objective (see Movies 1, 3 and the main text). (A,B) Snapshots from Movies 1 and 3 in the main text showing an overview of one side of the endoderm. Dashed-white lines indicate the midline. (A′,B′) Magnification of region in boxed area in A,B. Dashed-yellow lines indicate rosettes. (C1-D4′) Snapshots from Movies 1 and 3 showing relative positions of some endodermal cells, labeled with the same-colored number over time. Red arrows indicate cells that have squeezed between two neighboring cells; green lines indicate ML junctions (Type 3, T3; C1,C1′,D1,D2,D1′,D2′) shrunk to form a common vertex (Type 2, T2; C2,C2′); magenta line indicates new vertical junctions (Type 1, T1; C3,C3′); yellow lines (D2-D4,D2′-D4′) indicate multiple ML junctions contracting to form rosettes (outlined by dashed-cyan lines; D3,D4). (C1′-C4′,D1′-D4′) Outlines of some of the endodermal cells in C1-C4 and D1-D4 (white lines). (E-H) Quantification of cell behaviors, as represented in C1-C4 and D1-D4. (E) Shrinking rate of the T3 junction (from T3 to T2), with number of junctions analyzed shown. (F) Percentage of cell pairs separated along the AP axis, with number analyzed indicated. (G) Newly formed rosettes per 100 endodermal cells per hour. (H) Resolution time of rosettes formed during the first 60 min of the time-lapse movies (Movies 1, 3), with number analyzed indicated. (H) Total number of rosettes formed per 100 endodermal cells from the 7s-12 s stage. Data are mean±s.e.m. *P<0.05; **P<0.01; ***P<0.001; ****P<0.0001 (unpaired two-tailed Student's t-test). (J-K′) Confocal time-lapse experiments in control (six embryos) and gpc4−/− (six embryos) using a 40× oil objective (see Movies 2 and 4). (J,K) Snapshots from Movies 2 and 4. Yellow arrows indicate cell protrusions. (J′,K′) Rose plots showing orientation of cell protrusions in endodermal cells (bin size, 20°). |

