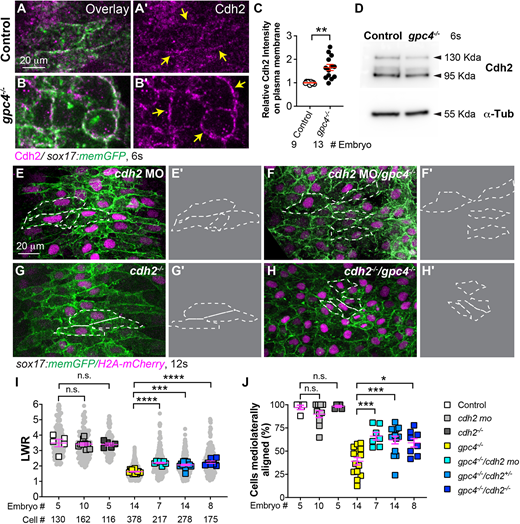
Fig. 5 Suppressing Cdh2 expression partially rescues polarity defects in gpc4-deficient endodermal cells. (A-B′) Confocal images (Z-projections) showing expression of Cdh2 (magenta, detected by immunostaining) of endodermal cells of the indicated embryos. (C) Relative intensity of Cdh2 expression on the plasma membrane of endodermal cells (yellow arrows) in embryos in A-B′. The number of embryos analyzed is indicated. **P<0.01 (unpaired, two-tailed Student's t-test). (D) Western blot showing expression of Cdh2 and α-Tubulin (internal control) at the 6s stage (representative of three biological replicates). (E-H′) Confocal images (Z-projections) showing endodermal cells in the embryos indicated. (E′,F′,G′,H′) Outlines of some endodermal cells in E,F,G,H (dashed-white lines). (I) Average length-to-width ratio (LWR) of endodermal cells in E-H. Data from all embryos (squares) and all cells (gray circles) are superimposed, with the number of cells and embryos indicated. (J) Percentage of ML-aligned endodermal cells in E-H. Data are mean±s.e.m. One-way ANOVA followed by a Tukey's multiple comparisons test: n.s., not significant, P>0.05, *P<0.05, ***P<0.001, ****P<0.0001.
Image
Figure Caption
Acknowledgments
This image is the copyrighted work of the attributed author or publisher, and
ZFIN has permission only to display this image to its users.
Additional permissions should be obtained from the applicable author or publisher of the image.
Full text @ Development

