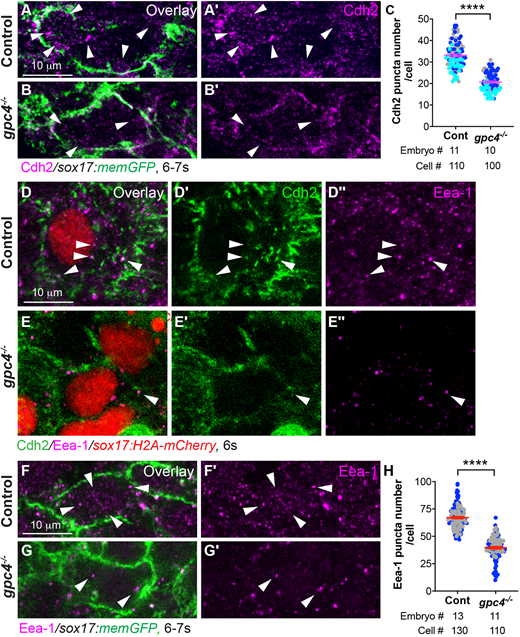
Fig. 6 Cdh2 endocytosis of endodermal cells is impaired in gpc4−/− embryos. (A-B′) Confocal images of Z-projections of the indicated embryos (high magnification and resolution) showing Cdh2 expression in endodermal cells, as detected by immunofluorescence. Arrowheads indicate cytoplasmic Cdh2-expressing puncta. (C) Average number of cytoplasmic Cdh2 puncta per cell in the indicated embryos from three experiments, represented by different colors. (D-E″) Confocal images of Z-projections showing the expression of Cdh2 and Eea-1 (detected by immunofluorescence) in endodermal cells from the indicated embryos. White arrowheads indicate Cdh2 and Eea-1 colocalized puncta. (F-G′) Single z-plane confocal images showing Eea-1 expression (detected by immunofluorescence) in endodermal cells from the indicated embryos. White arrowheads indicate Eea-1 expression. (H) Average number of cytoplasmic Eea-1-expressing puncta per cell in the indicated embryos from two separate experiments, represented by different colors. Data are mean±s.e.m. ****P<0.0001 (unpaired, two-tailed Student's t-test).
Image
Figure Caption
Acknowledgments
This image is the copyrighted work of the attributed author or publisher, and
ZFIN has permission only to display this image to its users.
Additional permissions should be obtained from the applicable author or publisher of the image.
Full text @ Development

