Figure 6—figure supplement 5.

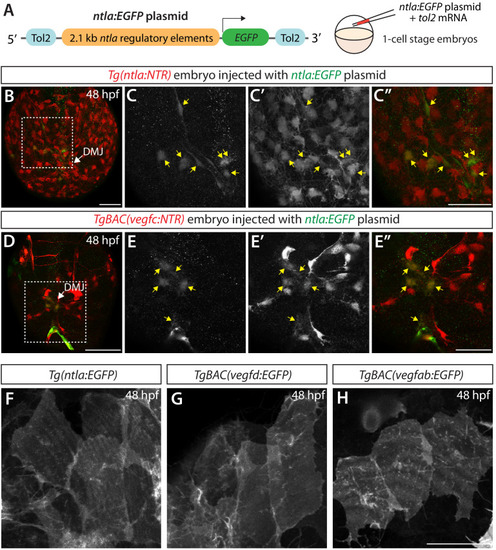
Co-localization of the mesodermal cell marker and <italic>TgBAC(vegfc:NTR)<sup>+</sup></italic> meningeal cells, and close similarity in cell morphology between mesoderm-derived meningeal fibroblasts and <italic>vegf</italic>-expressing meningeal cells.

(A) Schematic of the ntla:EGFP construct used for injection experiments (B–E"). (B–E") Dorsal views of 48 hpf Tg(ntla:NTR) (B–C") and TgBAC(vegfc:NTR) (D–E") heads of embryos that were injected with the ntla:EGFP construct at the one-cell stage. Magnified images of the boxed area in (B) and (D) are shown in (C–C") and (E–E"), respectively. Most of the EGFP+ cells (C and E) were co-localized with NTR-mCherry+ meningeal cells (C’ and E’) in Tg(ntla:NTR) (C–C") and TgBAC(vegfc:NTR) (E–E") embryos. Yellow arrows point to the co-localized cells (n = 5 embryos, 71 co-localized cells observed for Tg(ntla:NTR); n = 3 embryos, 10 co-localized cells observed for TgBAC(vegfc:NTR)). (F–H) Dorsal magnified views of 48 hpf Tg(ntla:Gal4-VP16);Tg(UAS:EGFP-CAAX), abbreviated Tg(ntla:EGFP), TgBAC(vegfd:EGFP), and TgBAC(vegfab:EGFP) embryonic heads near the DMJ in the dorsal surfaces of the brain meninges. Close similarity in the morphology of the EGFP+ meningeal cells marked by each of the lines was observed. Scale bars: 50 μm in (B–E"); 25 μm in (H).

Expression Data

Expression Detail
Antibody Labeling
Phenotype Data

Phenotype Detail
Acknowledgments
This image is the copyrighted work of the attributed author or publisher, and ZFIN has permission only to display this image to its users. Additional permissions should be obtained from the applicable author or publisher of the image. Full text @ Elife