
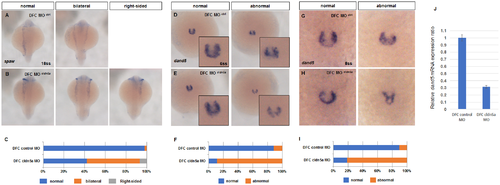
Fig. 3
Expressions of spaw and dand5 were disrupted in DFC cldn5a morphants. (A—B) Visualization of spaw by in situ hybridization in 18 ss embryos. Representative images of DFC control morphants (A) and DFC cldn5a morphants (B). (C) Stacked bar graph (blue; normal, orange; bilateral, grey; right-sided, DFC control morphants; n = 48, DFC cldn5a morphants; n = 45). (D—E) Visualization of dand5 by in situ hybridization in 6 ss embryos. Representative images of DFC control morphants (D) and DFC cldn5a morphants (E). (F) Stacked bar graph (blue; normal, orange; abnormal, DFC control morphants; n = 26, DFC cldn5a morphants; n = 36). (G—H) Visualization of dand5 by in situ hybridization in 8 ss embryos. Representative images of DFC control morphants (G) and DFC cldn5a morphants (E). (I) Stacked bar graph (blue; normal, orange; abnormal, DFC control morphants; n = 76, DFC cldn5a morphants; n = 82). (J) Relative dand5 mRNA expression in DFC cldn5a morphants versus DFC control morphants at 8 ss. Error bars indicate s.e.m. |
| Genes: | |
|---|---|
| Fish: | |
| Knockdown Reagent: | |
| Anatomical Terms: | |
| Stage Range: | 5-9 somites to 14-19 somites |
| Fish: | |
|---|---|
| Knockdown Reagent: | |
| Observed In: | |
| Stage Range: | 5-9 somites to 14-19 somites |