
FIGURE
Fig. S7
Fig. S7
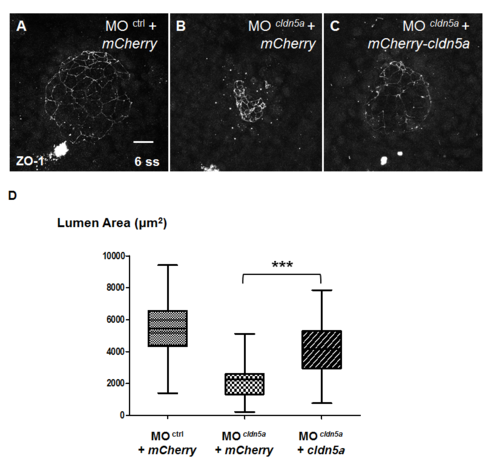
KV lumen area of cldn5a morphants was restored by exogenous cldn5a mRNA. (A—C) Maximum intensity projection images of ZO-1 in 6 ss embryos. Representative images of control morphants with mCherry (A), cldn5a morphants with mCherry (B), and cldn5a morphants with mCherry-cldn5a (C). (D) Statistical box and whisker graph (control morphants with mCherry; n = 25, cldn5a morphants with mCherry; n = 39, cldn5a morphants with mCherry-cldn5a; n = 43) *** depicts p < 0.001. Error bars indicates s.e.m. Scale bar: 20 μm. |
Expression Data
Expression Detail
Antibody Labeling
Phenotype Data
Phenotype Detail
Acknowledgments
This image is the copyrighted work of the attributed author or publisher, and
ZFIN has permission only to display this image to its users.
Additional permissions should be obtained from the applicable author or publisher of the image.
Full text @ PLoS One