
Fig. 6
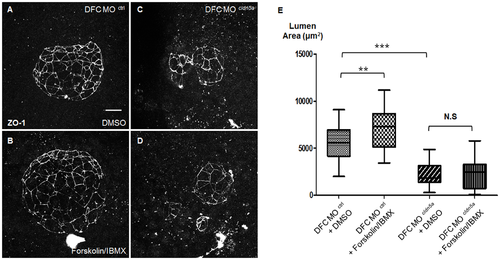
Treatment of forskolin and IBMX failed to recover the KV lumen size in DFC cldn5a morphants. (A—D) Maximum intensity projection images of ZO-1 in 6 ss embryos. Representative images of DFC control morphants treated with DMSO (A) or forskolin/IBMX (B). Representative images of DFC cldn5a morphants treated with DMSO (C) or forskolin/IBMX (D). (E) Statistical column bar graph (DFC control morphants with DMSO; n = 30, DFC control morphants with forskolin/IBMX; n = 28, DFC cldn5a morphants with DMSO; n = 19, DFC cldn5a morphants with forskolin/IBMX; n = 22). *** depicts p < 0.001, ** depicts p < 0.01, N.S. depicts p > 0.05. Error bars indicate s.e.m. Scale bar: 20 μm. |
| Fish: | |
|---|---|
| Condition: | |
| Knockdown Reagent: | |
| Observed In: | |
| Stage: | 5-9 somites |