
- Title
-
A zebrafish gephyrinb mutant distinguishes synaptic and enzymatic functions of Gephyrin
- Authors
- Brennan, E.J., Monk, K.R., Li, J.
- Source
- Full text @ Neural Dev.
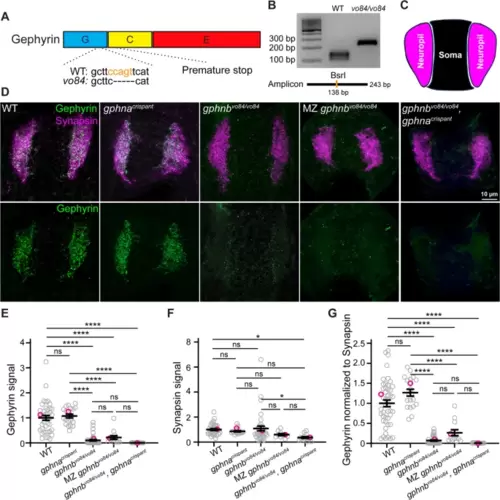
Generation and validation of gphnbvo84 mutants. A Schematic of Gephyrin protein showing its three domains and the 5 bp deletion in gphnbvo84 causing a frameshift and premature stop. The BsrI recognition site used for genotyping was indicated in orange. B Representative gel images for genotyping gphnbvo84. A BsrI recognition site is disrupted by gphnbvo84 mutation in the middle of the amplicon. C Schematic of neuropil (magenta) and soma (black) regions in transverse spinal cord section of zebrafish at 5 dpf. D Representative transverse sections in the spinal cord at 5 dpf with Gephyrin (green) and Synapsin (magenta) staining from the following conditions: wildtype (WT); gphnacrispant, gphnbvo84/vo84; maternal zygotic (MZ) gphnbvo84/vo84; and gphnbvo84/vo84, gphnacrispant. E–G Gephyrin signal (E), Synapsin signal (F) and Gephyrin normalized to Synapsin (G) from the spinal sections. nWT = 19 fish, 41 sections, 3 technical replicates; ngphna = 12 fish, 20 sections, 1 technical replicate; ngphnb = 18 fish, 42 sections, 3 technical replicates; nMZ gphnb = 7 fish, 13 sections, 1 technical replicate; and n = 8 fish, 15 sections, 1 technical replicate. E, F[4, 126] = 45.29; F, F[4, 116] = 3.303; G, F[4, 129] = 56.29. All data are represented as mean ± SEM; ns, not significant; *, p < 0.05; ****, p < 0.0001; the data points corresponding to the representative images are noted in pink; ns, not significant; (E–G) one-way ANOVA with Tukey’s post-hoc test; scale bars 10 μm |
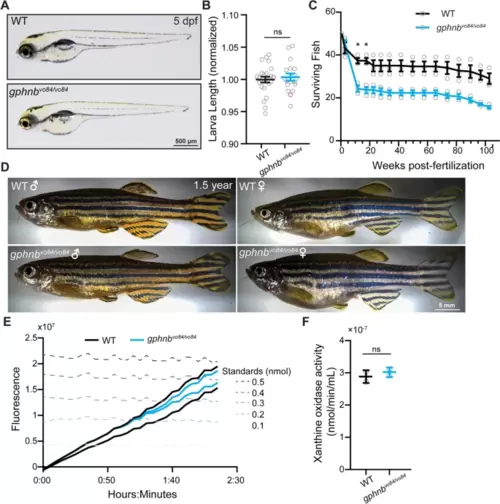
gphnbvo8/vo84 mutants exhibit normal gross morphology and xanthine oxidase activity. A Representative images of WT and gphnbvo84/vo84 zebrafish larvae at 5 dpf. B The body length of larvae at 5 dpf. nWT = 13 animals, ngphnb = 12 animals, 2 technical replicates. t[0.7040], df[23]. C Fish survival tracked from larvae to adults. 3 groups of 50 fish were tested per condition. Fwpf[2.289, 9.156] = 144.2, Fgenotype[1, 4] = 20.58, Finteraction[15, 60] = 16.14, Ftank[4, 60] = 67.54. D Representative images of 1.5 years old adult zebrafish of the indicated genotypes and sexes. E Xanthine oxidase activity measured by fluorometric assays over time in WT and gphnbvo84/vo84. Each trace represents the total activity of 15 animals combined at 5 dpf. F Quantification of the xanthine oxidase activity at the end of recording from (E). Two sets of homogenates, each consisting of 15 animals were tested for each condition. t[0.7709], df[2]. All data are represented as mean ± SEM; ns, not significant; *, p < 0.05; (B,F) unpaired t-tests; (C) two-way repeat measure ANOVA with Sidak’s multiple comparison test |

gphnbvo84/vo84 mutants exhibit swimming deficits against currents. A Representative snapshots of WT and MZ gphnbvo84/vo84 larvae in a forced group swimming assay at 0 and 14 s after the dish swirl. Inset shows the distribution of fish (green dots) with reference concentric regions. B The number of fish within concentric regions ranging from the center to the edge of a dish at 0s and 14s after the dish swirl. 5 dishes each containing 50 fish were tested per condition. Fconcentric[7, 72] = 56.910s, 79.5314s; Fgenotype[1, 72] = 0.034190s, 0.108114s; Finteraction[7, 72] = 1.6700s, 1.71314s. C Representative snapshots of an individual larva in a forced swimming assay with infrared light. The larva (red circle) was traced over time (blue). Inset shows the larva at higher magnification. D Distance of individual larvae of WT and gphnbvo84/vo84 from the dish center after the dish swirl. nWT = 21 animals, ngphnb = 11 animals, 1 technical replicate. E Swimming velocity of individual zebrafish larva after the dish swirl. nWT = 21 animals, ngphnb = 11 animals, 1 technical replicate. All data are represented as mean ± SEM; *, p < 0.05; (B,E) two-way ANOVA with Sidak’s multiple comparison test |
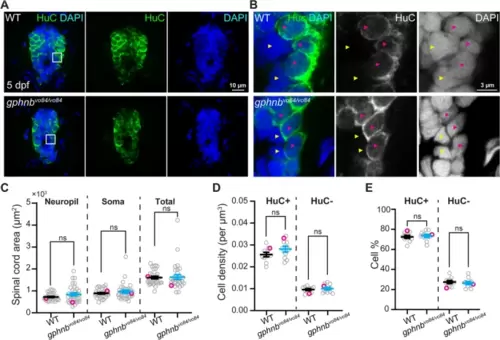
Cell densities are unchanged in gphnbvo84/vo84 mutant spinal cord. A Representative single-plane images of transverse larval spinal cord sections of WT and gphnbvo84/vo8 with HuC (green) and DAPI (blue) staining at 5 dpf. B Zoom-in image from (A) showing HuC+ (magenta arrowheads) and HuC- (yellow arrowheads) cells. C-E Quantifications of (C) transverse spinal cord area, (D) cell density, and (E) cell percentage from (A, B). C nWT = 22 fish, 31 sections; ngphnb = 20 fish, 32 sections; 6 technical replicates; tneuropil[1.483], tsoma[1.021], ttotal[0.1881], df[61]. (D,E) n = 7 fish, 10 sections per condition; 1 technical replicate; tHuC+density[1.619], tHuC-density[0.5591], t%[0.4604], df[18]. All data are represented as mean ± SEM; ns, not significant; (C-E) unpaired t-tests |
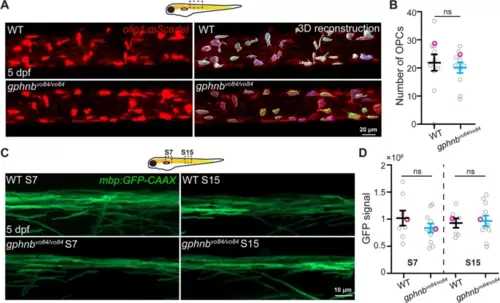
Oligodendrocyte precursors and myelin are unchanged in gphnbvo84/vo84 mutant spinal cord. A Representative in vivo images from Tg(olig1:mScarlet) and 3D reconstruction showing individual OPCs in the spinal cord of WT and gphnbvo84/vo84 at 5 dpf. B OPC number in 300-µm-length spinal cord from (A). nWT = 11 animals, ngphnb = 11 animals, 1 technical replicate, t[0.5192] df[20],. C Representative in vivo images of myelin in the dorsal spinal cord from Tg(mbp:GFP-CAAX) at body segment 7 (S7) and 15 (S15) of WT and gphnbvo84/vo84 at 5 dpf. D GFP signal intensity from (C). nWT = 8 animals, ngphnb = 11 animals, 1 technical replicate, F[3,, 33] = 0.6057. All data are represented as mean ± SEM; ns, not significant; (B) unpaired t-tests; (D) one-way ANOVA with Tukey’s post-hoc test |

GlyRs are reduced, but remain proximal to synaptic regions in the spinal cord of gphnbvo84/vo84 animals. A Representative transverse images of Gephyrin and GlyR staining from WT and gphnbvo84/vo84 at 5 dpf. From left, maximum z-projection, single plane, and zoom-in images. B GlyR signal normalized to WT from (A). nWT = 14 fish, 38 sections, ngphnb = 15 fish, 29 sections, 3 technical replicates, tneuropil[2.931] df[65], tsoma[0.2904] df[19]. C 3D reconstruction of GlyR from (A) with Imaris. D GlyR puncta number in 3D reconstruction from (C). nWT = 14 fish, 39 sections, ngphnb = 15 fish, 35 sections, 3 technical replicates, t[2.239], df[72]. E Representative transverse images of SV2 and GlyR staining from WT and gphnbvo84/vo84 at 5 dpf (maximum z-projection). F SV2 signal normalized to WT from (E). nWT = 7 fish, 19 sections, ngphnb = 8 fish, 27 sections, 2 technical replicates, t[1.602], df[44]. G 3D reconstruction of SV2 and GlyR from (E) with Imaris with zoom-in images on the right. In the zoom-in images, colocalizing puncta are in solid color and non-colocalizing puncta are transparent. H The percentage of GlyR that colocalize with SV2 from (G). nWT = 7 fish, 27 sections, ngphnb = 8 fish, 25 sections, 2 technical replicates, t[0.004848], df[50]. All data are represented as mean ± SEM; ns, not significant; *, p < 0.05; **, p < 0.01; (B,D,F,H) unpaired t-tests |