
|
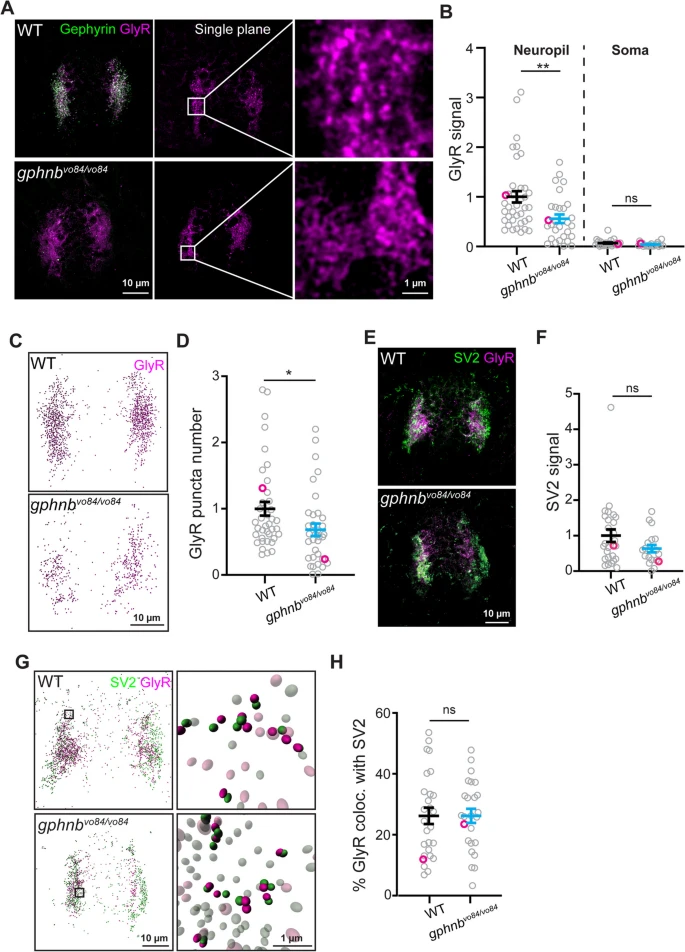
Fig. 6 GlyRs are reduced, but remain proximal to synaptic regions in the spinal cord of gphnbvo84/vo84 animals. A Representative transverse images of Gephyrin and GlyR staining from WT and gphnbvo84/vo84 at 5 dpf. From left, maximum z-projection, single plane, and zoom-in images. B GlyR signal normalized to WT from (A). nWT = 14 fish, 38 sections, ngphnb = 15 fish, 29 sections, 3 technical replicates, tneuropil[2.931] df[65], tsoma[0.2904] df[19]. C 3D reconstruction of GlyR from (A) with Imaris. D GlyR puncta number in 3D reconstruction from (C). nWT = 14 fish, 39 sections, ngphnb = 15 fish, 35 sections, 3 technical replicates, t[2.239], df[72]. E Representative transverse images of SV2 and GlyR staining from WT and gphnbvo84/vo84 at 5 dpf (maximum z-projection). F SV2 signal normalized to WT from (E). nWT = 7 fish, 19 sections, ngphnb = 8 fish, 27 sections, 2 technical replicates, t[1.602], df[44]. G 3D reconstruction of SV2 and GlyR from (E) with Imaris with zoom-in images on the right. In the zoom-in images, colocalizing puncta are in solid color and non-colocalizing puncta are transparent. H The percentage of GlyR that colocalize with SV2 from (G). nWT = 7 fish, 27 sections, ngphnb = 8 fish, 25 sections, 2 technical replicates, t[0.004848], df[50]. All data are represented as mean ± SEM; ns, not significant; *, p < 0.05; **, p < 0.01; (B,D,F,H) unpaired t-tests