
Fig. 4
- ID
- ZDB-FIG-240729-116
- Publication
- Brennan et al., 2024 - A zebrafish gephyrinb mutant distinguishes synaptic and enzymatic functions of Gephyrin
- Other Figures
- All Figure Page
- Back to All Figure Page
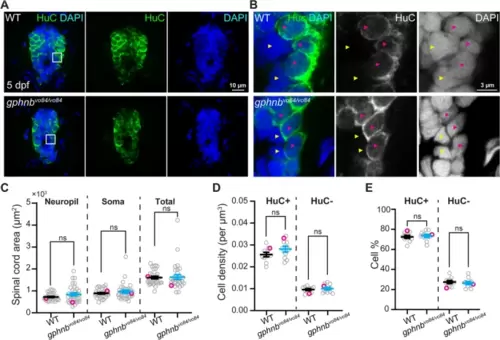
Cell densities are unchanged in gphnbvo84/vo84 mutant spinal cord. A Representative single-plane images of transverse larval spinal cord sections of WT and gphnbvo84/vo8 with HuC (green) and DAPI (blue) staining at 5 dpf. B Zoom-in image from (A) showing HuC+ (magenta arrowheads) and HuC- (yellow arrowheads) cells. C-E Quantifications of (C) transverse spinal cord area, (D) cell density, and (E) cell percentage from (A, B). C nWT = 22 fish, 31 sections; ngphnb = 20 fish, 32 sections; 6 technical replicates; tneuropil[1.483], tsoma[1.021], ttotal[0.1881], df[61]. (D,E) n = 7 fish, 10 sections per condition; 1 technical replicate; tHuC+density[1.619], tHuC-density[0.5591], t%[0.4604], df[18]. All data are represented as mean ± SEM; ns, not significant; (C-E) unpaired t-tests |