
|
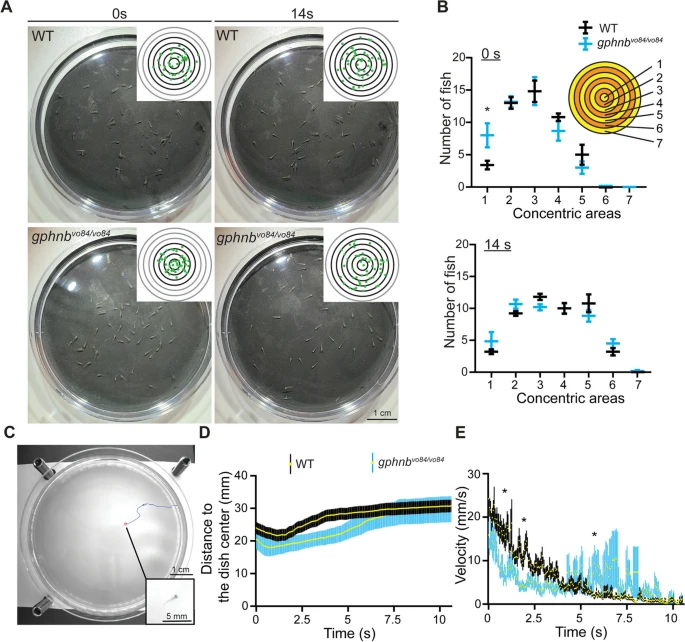
Fig. 3 gphnbvo84/vo84 mutants exhibit swimming deficits against currents. A Representative snapshots of WT and MZ gphnbvo84/vo84 larvae in a forced group swimming assay at 0 and 14 s after the dish swirl. Inset shows the distribution of fish (green dots) with reference concentric regions. B The number of fish within concentric regions ranging from the center to the edge of a dish at 0s and 14s after the dish swirl. 5 dishes each containing 50 fish were tested per condition. Fconcentric[7, 72] = 56.910s, 79.5314s; Fgenotype[1, 72] = 0.034190s, 0.108114s; Finteraction[7, 72] = 1.6700s, 1.71314s. C Representative snapshots of an individual larva in a forced swimming assay with infrared light. The larva (red circle) was traced over time (blue). Inset shows the larva at higher magnification. D Distance of individual larvae of WT and gphnbvo84/vo84 from the dish center after the dish swirl. nWT = 21 animals, ngphnb = 11 animals, 1 technical replicate. E Swimming velocity of individual zebrafish larva after the dish swirl. nWT = 21 animals, ngphnb = 11 animals, 1 technical replicate. All data are represented as mean ± SEM; *, p < 0.05; (B,E) two-way ANOVA with Sidak’s multiple comparison test