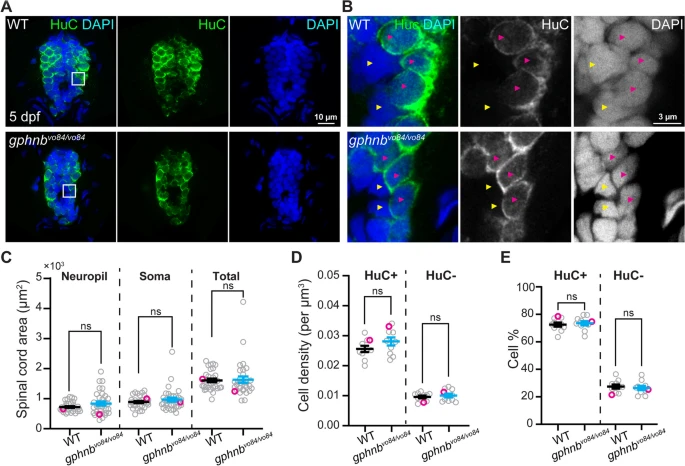
Fig. 4 Cell densities are unchanged in gphnbvo84/vo84 mutant spinal cord. A Representative single-plane images of transverse larval spinal cord sections of WT and gphnbvo84/vo8 with HuC (green) and DAPI (blue) staining at 5 dpf. B Zoom-in image from (A) showing HuC+ (magenta arrowheads) and HuC- (yellow arrowheads) cells. C-E Quantifications of (C) transverse spinal cord area, (D) cell density, and (E) cell percentage from (A, B). C nWT = 22 fish, 31 sections; ngphnb = 20 fish, 32 sections; 6 technical replicates; tneuropil[1.483], tsoma[1.021], ttotal[0.1881], df[61]. (D,E) n = 7 fish, 10 sections per condition; 1 technical replicate; tHuC+density[1.619], tHuC-density[0.5591], t%[0.4604], df[18]. All data are represented as mean ± SEM; ns, not significant; (C-E) unpaired t-tests
Image
Figure Caption
Acknowledgments
This image is the copyrighted work of the attributed author or publisher, and
ZFIN has permission only to display this image to its users.
Additional permissions should be obtained from the applicable author or publisher of the image.
Full text @ Neural Dev.

