FIGURE SUMMARY
Title

Macrophage transplantation rescues RNASET2-deficient leukodystrophy by replacing deficient microglia in a zebrafish model

Authors
Rutherford, H.A., Candeias, D., Duncan, C.J.A., Renshaw, S.A., Hamilton, N.
Source
Full text @ Proc. Natl. Acad. Sci. USA

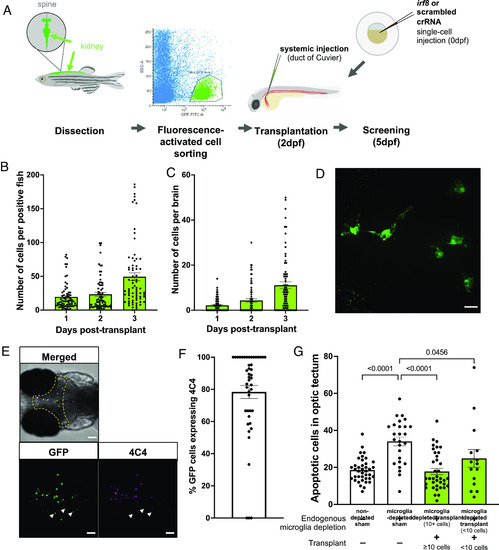
Macrophage transplantation successfully replaces microglia in WT zebrafish. (A) Transplants were performed by dissecting kidneys from Tg(fms:GFP) adult donors and isolating GFP-positive cells using fluorescence-activated cell sorting. Cells were injected into 2 dpf Tg(mpeg1:mCherryCAAX)sh378 hosts via duct of Cuvier. Hosts had previously undergone microglia depletion via targeting of irf8 by CRISPR/Cas9 or were nondepleted with a scrambled control. (B and C) The number of fms:GFP cells per successfully transplanted animal increased throughout the whole body (B) and within the brain (C) across 3 d post-transplant, as revealed by manual counting. (D) Confocal imaging reveals that transplant-derived cells show a branched, microglia-like morphology. The scale bar represents 17 µm. (E and F) Transplant-derived cells express the microglia-specific marker 4C4 at 3 d post-transplant (5 dpf). Colocalization was assessed by manual counting. Arrows indicate GFP-positive cells that do not co-localize with 4C4. The yellow dashed line indicates the border of the optic tectum (region of interest). Three biological replicates, n = 45. The scale bar represents 75 µm. (G) TUNEL staining reveals that transplantation can rescue the number of uncleared apoptotic cells in microglia-depleted brains in a dose-dependent manner, as revealed by manual counting of cells within optic tectum as in E. Kruskal–Wallis test with Dunn’s multiple comparisons. Four biological replicates, n = 15 to 39.

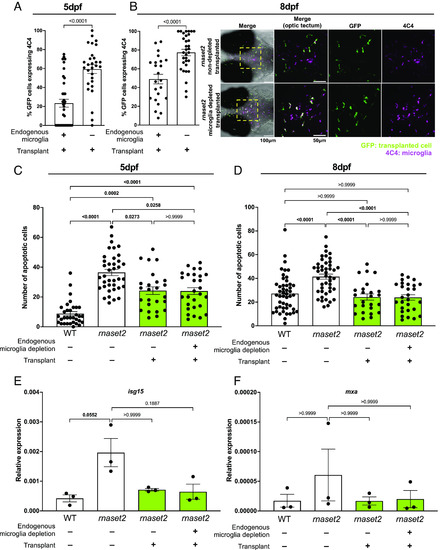
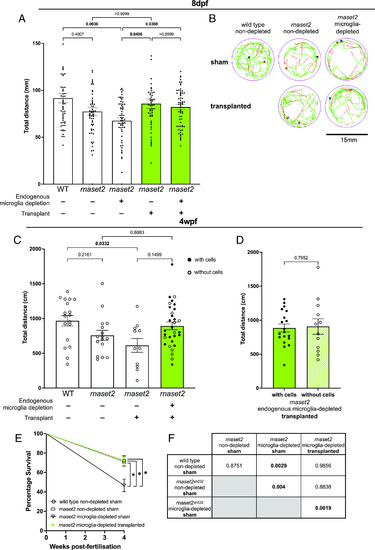
Macrophage transplantation reduces early neuropathology in rnaset2 mutants. (A and B) Quantification of 4C4-expression of transplant-derived cells in microglia-depleted versus nondepleted rnaset2 hosts at 5 (A) and 8 dpf (B) reveals reduced expression of 4C4 by transplanted cells in nondepleted hosts. Mann Whitney test. Three biological replicates, n = 29 to 37 (A), three biological replicates, n = 23 to 32 (B). (C and D) Macrophage transplantation reduces the number of uncleared apoptotic cells in the optic tectum of 5 (C) and 8 dpf (D) rnaset2 mutants. Kruskal–Wallis test with Dunn’s multiple comparisons. Four biological replicates, n = 25 to 38 (C), three biological replicates, n = 25 to 48 (D). (E and F) qPCR reveals that isg15 (E) and mxa (F) expression is reduced in transplanted animals, relative to WT controls. Kruskal–Wallis test with Dunn’s multiple comparisons. Three biological replicates, 15 embryos pooled per replicate.

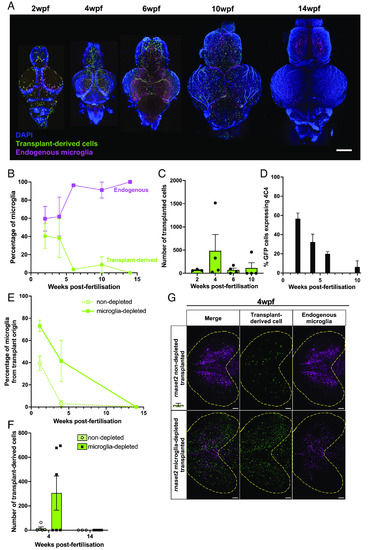
Transplanted cells persist in host brains throughout juvenile stages. (A) Tissue clearing and immunohistochemistry reveal that transplant-derived cells persist in WT microglia-depleted host brains until 10 wpf but are cleared by 14 wpf. Scale bar represents 400 µm. (B) Percentage of microglia from transplant origin gradually decreases in host brains until 14 wpf. (C) The number of transplant-derived cells peaks at 4 wpf and rapidly decreases thereafter. (D) Percentage of transplant-derived cells expressing microglia marker 4C4 steadily decreases from 2 wpf. Three to four biological replicates per timepoint. (E and F) Tissue clearing and immunohistochemistry reveal reduced numbers of transplant-derived cells in nondepleted rnaset2 animals compared with microglia-depleted siblings. Cells are no longer visible in both host groups by 14 wpf. (G) Representative image of transplant-derived cell engraftment at 4 wpf in nondepleted and microglia-depleted rnaset2 hosts. Yellow line indicates optic tectum outline. The scale bar represents 100 µm.

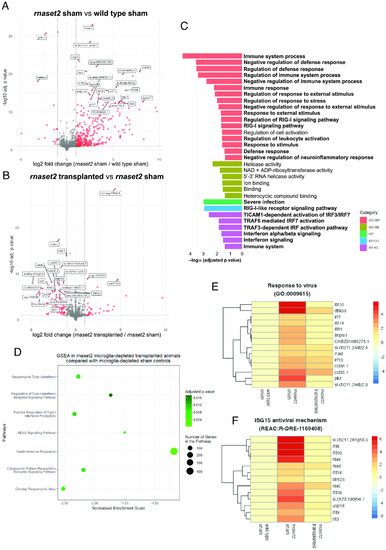
RNA sequencing reveals that microglia replacement rescues antiviral immune response in 4 wpf rnaset2 mutants. (A and B) Volcano plot of differentially expressed genes between rnaset2 sham versus WT sham (A) and rnaset2 transplanted versus rnaset2 sham groups (B). Significantly differentially regulated genes are shown in red. The top 25 differentially expressed genes are annotated. (C) Gene ontology (GO) plot showing significantly downregulated pathways in rnaset2 microglia-depleted transplanted animals compared with microglia-depleted sham controls, identified by gProfiler. Pathways relating to immune and antiviral response are indicated in bold. (D) Gene set enrichment analysis (GSEA) in rnaset2 microglia-depleted transplanted animals compared with rnaset2 microglia-depleted sham controls. (E and F) Heatmap of genes belonging to response to virus (E) and ISG15 antiviral mechanism (F) GO pathways for all genes significantly up-regulated in rnaset2 sham animals. Fold change relative to WT sham is indicated by color, with red indicating higher expression. All data shown correspond to microglia-depleted animals. See also SI Appendix, Fig. S4.

Transplantation rescues rnaset2 mutant swimming behavior and survival. (A) Live tracking of larval swimming behavior reveals that transplanted rnaset2 mutants swim greater distances than nontransplanted controls. Kruskal–Wallis test with Dunn’s multiple comparisons. Three biological replicates, n = 52 to 60. (B) Representative traces of free-swimming behavior of zebrafish larvae. The green line represents slow movements (3.0 to 6.6 mm/s), red line represents fast movements (>6.6 mm/s). (C) Tracking of 4 wpf juvenile behavior reveals that transplantation restores rnaset2 swimming behavior to WT levels. Kruskal–Wallis test with Dunn’s multiple comparisons, n = 11 to 31. (D) Swimming behavior was comparable between rnaset2 microglia-depleted transplanted animals that had persistent engraftment of transplanted cells and those which did not. Mann–Whitney U test, n = 12 to 19. (E and F) Percentage survival of transplanted rnaset2 mutants is greater than microglia-depleted sham controls at 4 wpf. Pairwise comparisons and corresponding P values shown in F, bold indicates significance. Log rank Mantel–Cox test with Bonferroni’s multiple comparison correction (Bonferroni-corrected threshold: P < 0.00833; family-wise significance threshold: P < 0.05). Three biological replicates, n = 60 to 86.

Acknowledgments
This image is the copyrighted work of the attributed author or publisher, and ZFIN has permission only to display this image to its users. Additional permissions should be obtained from the applicable author or publisher of the image. Full text @ Proc. Natl. Acad. Sci. USA