FIGURE SUMMARY
Title

Deficiency of the HGF/Met pathway leads to thyroid dysgenesis by impeding late thyroid expansion

Authors
Fang, Y., Wan, J.P., Wang, Z., Song, S.Y., Zhang, C.X., Yang, L., Zhang, Q.Y., Yan, C.Y., Wu, F.Y., Lu, S.Y., Sun, F., Han, B., Zhao, S.X., Dong, M., Song, H.D.
Source
Full text @ Nat. Commun.

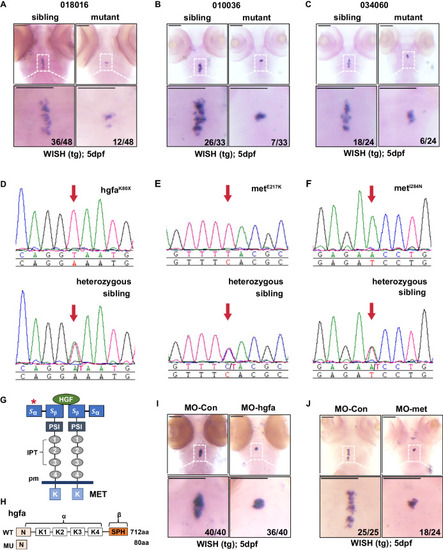
Identification of hgfa and met mutations from three zebrafish lines with abnormal thyroid morphology by whole-exome sequencing and positional cloning.

A–C Three lines with abnormal thyroid morphology were screened by ENU. Thyroid marked by tg in 5 dpf larvae using WISH. Nearly 25% of the progeny from intercrossed heterozygotes exhibited an abnormal small thyroid morphology. Siblings contained wild-type and heterozygous larvae. Three independent experiments were carried for A–C. D–F Three mutants from the three zebrafish lines had mutations in hgfa and met that caused by K80X, E217K, and I284N amino acid substitutions, respectively. Verification by Sanger sequencing. G Diagram of the HGF/Met axis showing the mutations of Met localized in the Sema α domain. H Structures of the wild-type and mutant hgfa proteins. I, J Embryos injected with translation-blocking hgfa morpholinos (MO-hgfa) or met morpholinos (MO-met) to knock down hgfa or met induced the phenotype of abnormal small thyroid morphology at 5 dpf, as detected by in situ hybridization using tg as a probe. Three independent experiments were carried for I, J. MO-Con, embryos injected with standard control morpholino. Scale bars: 100 μm.

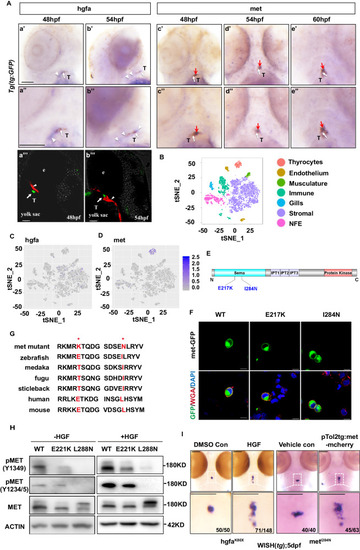
The orthologous human MET mutations, I284N and E217K, impair HGF signaling.

A The spatiotemporal expression of hgfa and met in zebrafish embryos. hgfa is expressed around the thyroid primordium at 48 hpf and 54 hpf; met is colocalized in a portion of thyrocytes with tg in the embryos at 48–60 hpf, as detected by WISH. hgfa mRNA: blue, arrowhead on panel A; met mRNA: blue, red arrow on panel A; T: thyroid; tg:GFP caax: brown, white arrow on panel A. hgfa and met mRNA were detected by WISH, and thyrocytes were marked by immunohistochemical staining for GFP. a’, b’, a”, b”: left lateral position; a”’, b”’: right lateral position; c’–e’ and c”–e”: dorsal position. Scale bars: 100 μm. e:eye; hgfa mRNA was detected by fluorescence in situ hybridization, and thyrocytes were marked by immunofluorescence staining for GFP in Aa”’ and Ab”’. Three independent experiments were carried for A. B–D A single-cell atlas of the zebrafish thyroid gland showing that hgfa was expressed in some stromal cells but met was restrictedly expressed in thyrocytes (https://sumeet.shinyapps.io/zfthyroid). E Mutation sites in the secondary structure of the MET protein. Diagram of MET showing that the E217K and I284N substitutions are localized to the semaphorin-like domain (Sema), which contains the furin cleavage site (residues 302–307). F Immunofluorescence staining of HEK293T cells transfected with the zmetWT, zmetI217K and zmetI284N plasmids, respectively. WGA staining (red) marks the cell membrane, and DAPI staining (blue) marks the nuclei. Three independent experiments were repeated with similar results. Scale bars: 100 μm. G The E217K and I284N substitutions in the mutants represent a significant shift in amino acids that are relatively conserved in vertebrates. H Western blotting was performed to analyze the expression and phosphorylation of MET in TOV112D cells transfected with plasmids containing human METWT, METE221K or METL288N after treatment with or without the human HGFα protein. Three independent experiments were repeated with similar results. I The rescue effects of human HGF factors or zebrafish wild-type met injection (pTol2tg:met-mCherry) on thyroid development are displayed. DMSO con, embryos injected with dimethyl sulfoxide (DMSO). Vehicle con, embryos injected with pTol2tg:mCherry. Scale bars: 100 μm. Three independent experiments were carried for I.

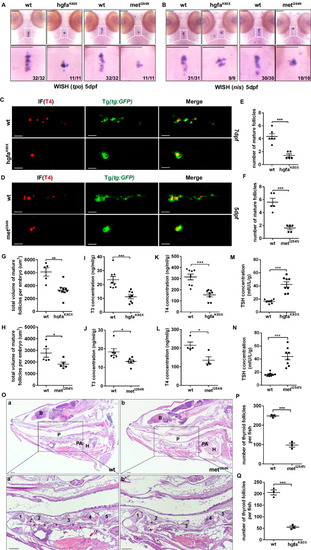
The hgfaK80X and metI284N mutations result in hypothyroidism in zebrafish.

A, B The expression of tpo and nis, two specific thyroid markers, in wild-type or homozygous hgfaK80X and metI284N mutant zebrafish larvae at 5 dpf was detected via WISH. C–H Confocal examination of mature thyroid follicles marked by T4 immunofluorescence in the tg transgenic zebrafish line Tg(tg:EGFP) at 7 dpf C and 5 dpf D. C, D: ventral position, anterior is to the left. The total number E, F and volume G, H of thyroid follicles per larva were quantified. n = 6 for WT and n = 5 for hgfaK80X in E (P = 0.0003), n = 5 for WT and n = 5 for metI284N in F (P = 0.00027), n = 5 for WT and n = 9 for hgfaK80X in G (P = 0.0012), n = 5 for WT and n = 5 for metI284N in H (P = 0.0462). I–N The levels of thyroid hormones (T3, T4 and TSH) were detected via ELISA in 1.5-month-old WT and hgfaK80X- or metI284N- mutant zebrafish. The three individual zebrafish were pooled. After homogenization, the T3 and T4 concentrations in the supernatant were measured. Each group was analyzed in triplicates. n = 8 for each group in I (P = 0.00068), K (P = 0.00013), M (P = 0.00002), N (P = 0.00008); n = 6 for each group in J (P = 0.0268); n = 4 for each group in L (P = 0.01999). O Hematoxylin and eosin staining of sagittal sections of thyroid follicles from 1.5-month-old WT and metI284N- mutant zebrafish. P, Q Quantification of the number of thyroid follicles in 1.5-month-old WT and mutant zebrafish. N = 3 for each group (P = 0.0002 for P, P = 0.00026 for Q). B, brain; p, pharyngeal; PA, pericardial aorta; H, heart; 1–5, cartilage; *thyroid follicles. Scale bars: 100 μm. *represents P < 0.05, ***represents P < 0.001. Data are presented as the mean ± SEM. Group comparisons were performed with two-sided Student’s t test. Source data are provided as a Source data file.

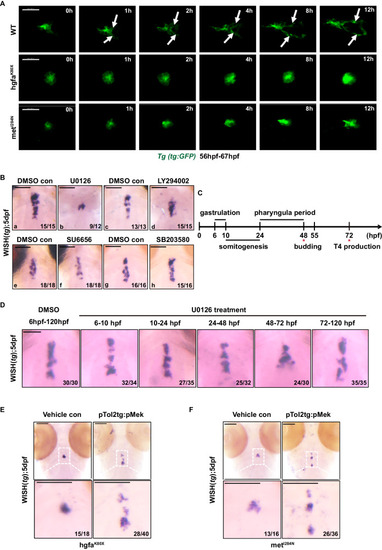
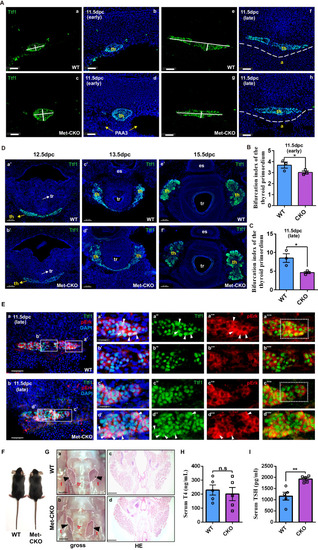
Hgf/met promotes caudal expansion along the pharyngeal midline during the late stage of thyroid development via the MAPK signaling pathway.

A The Tg(tg:EGFP) transgenic zebrafish line was used to analyze the time lapse of thyroid development. Representative images chosen from Supplementary Movies 13 showing the differential thyroid phenotypes of wild-type and hgfa/met mutant embryos (ventral view, anterior is to the left). Scale bars: 30 μm. White arrows mark that thyroid primordium caudally expand along the pharyngeal midline in wild-type zebrafish. B Thyroid defects in small molecule-treated larvae. Inhibitors of MEK (U0126) successfully mimicked the small thyroid phenotypes in hgfa or met mutant embryos, while inhibitors of MAPK p38 (SB203580), PI3K (LY294002) and STAT3 (SU6656) had little effect on thyroid development. C, D WT embryos were treated with the MEK inhibitor U0126 during the different developmental stage of the zebrafish embryos. In panel C, the treatment periods of gastrulation and somitogenesis cover developmental periods preceding thyroid anlage formation (approximately 24 hpf), whereas the treatment period in the pharyngula represents the developmental period after the onset of thyroid anlage formation. The treatment period from 48–72 hpf covers the developmental period of during which the thyroid primordium forms branches. The treatment period during 3–5 dpf covers the developmental period of thyrocyte proliferation. In panelD, the thyroid primordium was detected by WISH using tg as a probe in 5 dpf larvae after treatment with U0126. Scale bars: 100 μm. E, F The rescue effects of continuously phosphorylated MEK (pTol2tg:pMek) on thyroid development in hgfaK80XE and metI284NF homozygous embryos were visualized via WISH. Scale bars: 100 μm. Three independent experiments were carried for B, D–F.

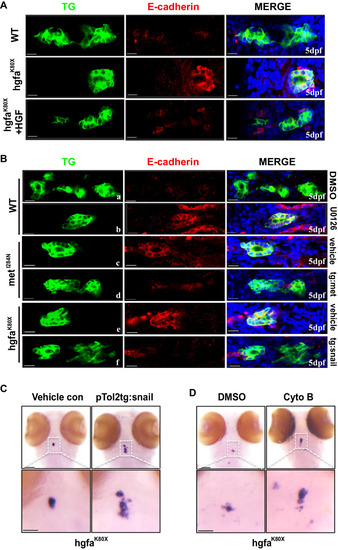
Hgf/met downregulates E-cadherin by activating MAPK-snail in vivo.

A Increased expression of E-cadherin in the thyroid primordium of hgfa homozygous mutant embryos was rescued by HGF injection. Larvae were in the ventral position, anterior to the right. B The expression of E-cadherin in the thyroid primordium of 5dpf zebrafish larvae under different conditions, including WT larvae treated with U0126 (b), met homozygous mutant embryos rescued by injection of pTol2tg:met (d), and hgfa homozygous mutant embryos rescued by injection of pTol2tg:Snail (f). Larvae were in the ventral position, anterior to the left. C The abnormal thyroid primordium in 5 dpf hgfa homozygous mutant larvae was rescued by specific overexpression of human Snail (pTol2tg:Snail) in thyrocytes. Vehicle con: 5dpf hgfa homozygous mutant larvae injected with pTol2tg:mCherry. D The rescue effects of the actin polymerization inhibitor cytochalasin B (cyto B) on the abnormal thyroid primordium in 5 dpf hgfa homozygous mutant larvae of zebrafish, detected by WISH in 5 dpf larvae. DMSO: 5dpf hgfa homozygous mutant larvae incubated with dimethyl sulfoxide (DMSO). Scale bars: 30 μm for A, B and 100 μm for C, D. Three independent experiments were repeated with similar results.

HGF-MET-ERK signaling promotes the thyroid bifurcation in mice.

A Compared to that in WT mice, bilateral elongation of the midline thyroid primordium in Met-CKO mice was delayed at E11.5. th: thyroid primordium; PAA3: third pharyngeal arch artery; a: aortic arch; scale bars: 50 μm. B, C Statistical assessment of the bifurcation index of the thyroid primordium in Met-CKO mice and WT mice at E11.5. The bifurcation index of the thyroid primordium was calculated as the ratio of the maximum transverse diameter to the maximum vertical diameter at the maximum section of the thyroid primordium in E11.5 embryos. N = 3 biologically independent samples (P = 0.0477 for B and P = 0.0159 for C). D Thyroid progenitors were identified by Ttf1 expression. There were no obvious abnormalities in the late bifurcation (E12.5), bilobation (E13.5) or lobe growth (E15.5) of the thyroid primordium in Met-CKO mice. th, thyroid primordium; es, esophagus; tr, trachea; scale bars: 50 μm. E Representative images showing the expression of pErk in thyrocytes in the maximum transverse section of the thyroid primordium in E11.5 embryos from WT and Met-CKO mice. The boxes in a’ and c’ indicate representative regions of lead cells at the free edge of the thyroid primordium in WT and Met-CKO mice, respectively; the boxes in b’ and d’ indicate representative regions of the following cells at the middle of the thyroid primordium in WT and Met-CKO mice, respectively. The arrowheads point to the thyrocytes with positive pErk. The dashed boxes in a”” and c”” represent the most different regions. Scale bars: 30 μm for a, b, 15 μm for (a’, c’). F, G Adult Met-CKO mice had a normal size and shape of the thyroid gland. t, thyroid lobe; tr, trachea. Scale bars: 800 μm for a, b, 200 μm for c, d. H, I Histograms showing the serum levels of T4 H and TSH I in one-month-old WT and Met-CKO mice. N = 5 biologically independent samples (P = 0.321 for H, P = 0.0016 for I). n.s represents not significant, *represents P < 0.05, **represents P < 0.01. Data are presented as the mean ± SEM. Group comparisons were performed with one-sided Student’s t test. Source data are provided as a Source data file.

Acknowledgments
This image is the copyrighted work of the attributed author or publisher, and ZFIN has permission only to display this image to its users. Additional permissions should be obtained from the applicable author or publisher of the image. Full text @ Nat. Commun.