|
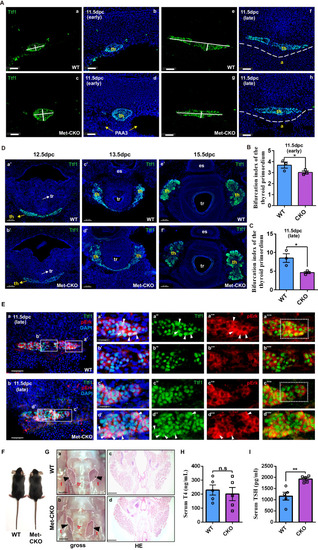
HGF-MET-ERK signaling promotes the thyroid bifurcation in mice. A Compared to that in WT mice, bilateral elongation of the midline thyroid primordium in Met-CKO mice was delayed at E11.5. th: thyroid primordium; PAA3: third pharyngeal arch artery; a: aortic arch; scale bars: 50 μm. B, C Statistical assessment of the bifurcation index of the thyroid primordium in Met-CKO mice and WT mice at E11.5. The bifurcation index of the thyroid primordium was calculated as the ratio of the maximum transverse diameter to the maximum vertical diameter at the maximum section of the thyroid primordium in E11.5 embryos. N = 3 biologically independent samples (P = 0.0477 for B and P = 0.0159 for C). D Thyroid progenitors were identified by Ttf1 expression. There were no obvious abnormalities in the late bifurcation (E12.5), bilobation (E13.5) or lobe growth (E15.5) of the thyroid primordium in Met-CKO mice. th, thyroid primordium; es, esophagus; tr, trachea; scale bars: 50 μm. E Representative images showing the expression of pErk in thyrocytes in the maximum transverse section of the thyroid primordium in E11.5 embryos from WT and Met-CKO mice. The boxes in a’ and c’ indicate representative regions of lead cells at the free edge of the thyroid primordium in WT and Met-CKO mice, respectively; the boxes in b’ and d’ indicate representative regions of the following cells at the middle of the thyroid primordium in WT and Met-CKO mice, respectively. The arrowheads point to the thyrocytes with positive pErk. The dashed boxes in a”” and c”” represent the most different regions. Scale bars: 30 μm for a, b, 15 μm for (a’, c’). F, G Adult Met-CKO mice had a normal size and shape of the thyroid gland. t, thyroid lobe; tr, trachea. Scale bars: 800 μm for a, b, 200 μm for c, d. H, I Histograms showing the serum levels of T4 H and TSH I in one-month-old WT and Met-CKO mice. N = 5 biologically independent samples (P = 0.321 for H, P = 0.0016 for I). n.s represents not significant, *represents P < 0.05, **represents P < 0.01. Data are presented as the mean ± SEM. Group comparisons were performed with one-sided Student’s t test. Source data are provided as a Source data file.
|