
- Title
-
The zebrafish heart harbors a thermogenic beige fat depot analog of human epicardial adipose tissue
- Authors
- Morocho-Jaramillo, P.A., Kotlar-Goldaper, I., Zakarauskas-Seth, B.I., Purfürst, B., Filosa, A., Sawamiphak, S.
- Source
- Full text @ Cell Rep.
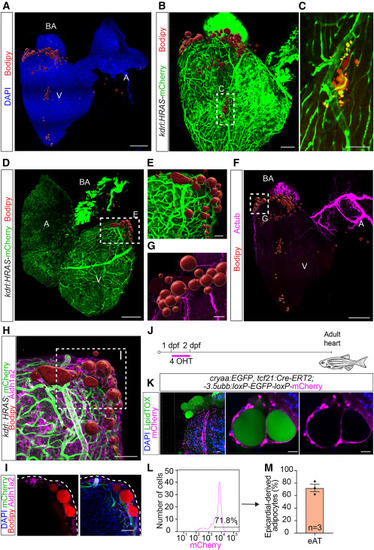
Anatomical localization, subtissular niche, and epicardial origin identify a zebrafish cardiac fat depot equivalent to the mammalian eAT (A) Zebrafish eAT localizes mainly at the anterior pole of the heart. Shown is a confocal image of an adult zebrafish heart stained with BODIPY 558/568 C12 to detect lipids (adipocytes) and DAPI. Scale bar, 200 μm. (B and C) Zebrafish eAT is in contact with major coronary vessels. (B) A kdrl:Has.HRAS-mCherry zebrafish heart, immunostained for mCherry and stained with BODIPY 558/568 C12. Scale bar, 100 μm. (C) Enlargement of the boxed area in (B). Scale bar, 50 μm. (D and E) Vascularization of zebrafish eAT by underlying coronary vessels. (D) A kdrl:Has.HRAS-mCherry zebrafish heart, immunostained for mCherry and stained with BODIPY 558/568 C12. Scale bar, 200 μm. (E) Enlargement of the boxed area in (D). Scale bar, 50 μm. (F and G) Zebrafish eAT is highly innervated. (F) Heart immunostained for acetylated tubulin (Actub). Adipocytes were visualized with BODIPY 558/568 C12 staining. Scale bar, 200 μm. (G) Digitally traced nerves from the boxed area in (F). Scale bar, 50 μm. (H and I) The fat depot is located underneath the epicardium. (H) Adult kdrl:Has.HRAS-mCherry zebrafish heart, immunostained for the epithelial marker Aldh1a2 and mCherry. Adipocytes were visualized with BODIPY 558/568 C12 staining. Scale bar, 50 μm. (I) A single confocal plane of the boxed region in (H). Scale bar, 50 μm. (J and K) Epicardial origin of zebrafish eAT. (J) Schematic of the epicardial linage tracing approach. 4-OHT-mediated induction of Cre recombination in tcf21:Cre-ERT2; ubb:loxP-EGFP-loxP-mCherry fish at 1–2 days post fertilization (dpf) enabled labeling of cells derived from tcf21+ proepicardial cells in the adult heart. (K) Epicardium-derived cells were visualized by mCherry immunostaining and adipocytes by LipidTOX. DAPI labeled all cell nuclei in the heart. Scale bar, 20 μm. (L) Representative flow cytometry plot showing distribution of tcf21:Cre-ERT2 traced cells by mCherry fluorescence intensities. (M) Graph showing average percentage of mCherry+ epicardium-derived adipocytes in the zebrafish heart. V, ventricle; A, atrium; BA, bulbus arteriosus. Adipocytes in (A), (B), and (D)–(H) are shown as 3D surface-rendered objects. All images represent observations from 3 animals per group. |
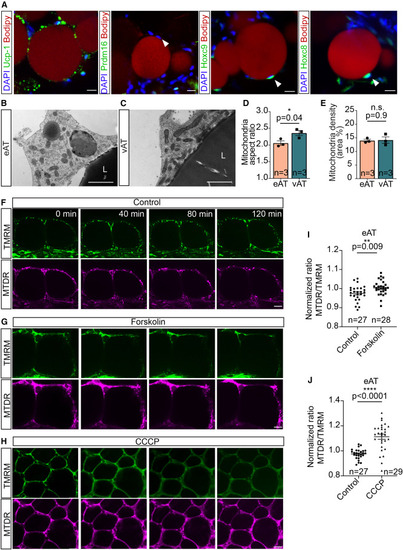
Zebrafish eAT possesses molecular signatures, subcellular morphology, and thermogenic capability typical of beige adipocytes (A) Confocal images of zebrafish hearts immunostained for the brown/beige markers Ucp1 and Prdm16 or the white adipocyte markers Hoxc8 and Hoxc9 and stained with BODIPY 558/568 C12 and DAPI. Arrowheads indicate adipocyte nuclei. Scale bar, 10 μm. (B–E) Electron microscopy images depicting round and fragmented mitochondria in zebrafish eAT (B) compared with the elongated and tubular morphology common in adipocytes from visceral adipose tissue (vAT) (C). L, lipid droplet. Scale bar, 1 μm. A bar graphs show the mitochondrial aspect ratio in eAT and vAT (D) and mitochondrial density (per cytoplasmic area of individual cells) in eAT and vAT (E). (F–J) Forskolin induces thermogenesis in the eAT. (F–H) Still images captured from time-lapse imaging of explanted hearts show changes of fluorescence intensity in epicardial adipocytes, co-stained with MitoTracker Deep Red (MTDR) and tetra-methyl rhodamine methyl ester (TMRM), following vehicle (F), forskolin (G), or carbonylcyanide-3-chlorophenylhydrazone (CCCP) (H) treatment. Scale bars, 20 μm. (I and J) Scatterplots showing increased thermal ratios (MTDR/TMRM) of epicardial adipocytes, stimulated by forskolin (I) or CCCP (J), compared with vehicle treatment. Data in (D), (E), (I), and (J) are presented as mean ± SEM. n.s., not significant. ∗p < 0.05, ∗∗p < 0.01, ∗∗∗p < 0.001, two-tailed t test. n indicates number of animals (D and E) and number of adipocytes obtained from three fish per condition (I and J). |
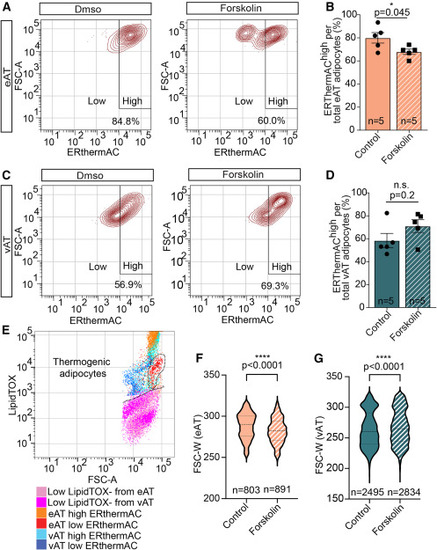
Heterogeneity of thermogenic activity, fueled by lipolysis in zebrafish eAT (A) Representative contour plots of flow cytometry analysis revealing a forskolin-stimulated ERthermAClow population in zebrafish eAT. (B) Bar graph displaying a reduction of ERthermAChigh adipocytes in the eAT following forskolin exposure. (C) Contour plots showing no detectable shift of intensity of ERthemAC by flow cytometry in the vAT adipocytes treated with forskolin compared with control solution-treated ones. (D) Bar graph showing unaltered percentages of ERthemAChigh adipocytes in the vAT following forskolin exposure compared with controls. (E) Dot plot showing lower lipid content (stained with LipidTOX) following forskolin stimulation in ERthemAClow (thermogenic) compared with ERthemAChigh (non-thermogenic) adipocytes from eAT but not vAT. A dashed line encircles the thermogenic eAT population. (F and G) Violin plots showing size distribution of epicardial (F) and abdominal (G) adipocytes before and after forskolin treatment. Middle lines indicate the median, and lower and upper lines indicate the first and third quartile, respectively. Data in (B) and (D) are presented as mean ± SEM. ∗p < 0.05, ∗∗∗∗p < 0.0001, two-tailed t test. n indicates number of animals (B and D) or number of cells from three fish per condition (F and G). |
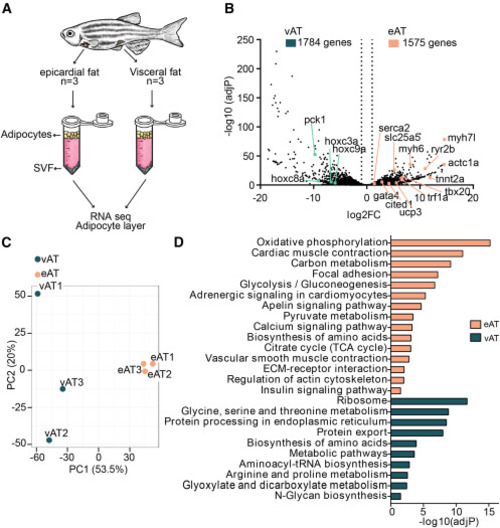
RNA-seq of adipocytes isolated from eAT and vAT reveals markedly different genome-wide expression profiles between the fat depots (A) Schematic of the bulk RNA-seq approach for isolated adipocytes. SVF, stromal vascular fraction. (B) Volcano plot displaying differentially expressed genes in eAT compared with vAT. The x axis shows fold change on a log2 scale and the y axis adjusted p value on a −log10 scale. A total of 1,575 genes were upregulated in zebrafish eAT and 1,784 genes in the vAT. (C) Principal-component analysis (PCA) score plot showing clustering of adipocytes based on tissue type. (D) KEGG enrichment pathways from differentially expressed genes in the eAT versus vAT, expressed as the −log10[P] adjusted for multiple comparisons. Data were obtained from 3 animals per group. |

Comparative analysis of the transcriptomic profiles of zebrafish and healthy human epicardial adipocytes (A) Schematic of the cross-species analysis focusing on high confidence “one-to-one” orthologs between zebrafish and human genes. (B) PCA score plot showing clustering of adipocyte populations according to species and tissue type. (C) Heatmap of the top 34 differentially expressed genes (DEGs) in the eAT compared with classic white fat depots, revealing a shared transcriptomic signature of the eAT across species. Shared upregulated or downregulated DEGs in zebrafish and human eATs are highlighted in black boxes. (D) Scatterplot displaying commonly upregulated (red box) and downregulated (green box) genes in human and zebrafish eAT as well as highly expressed genes in human eAT that are downregulated in the zebrafish tissue (orange box) and vice versa (blue box). (E) Top enriched pathway (KEGG and Reactome) of the 197 upregulated genes in zebrafish and human eAT compared with visceral (vAT) and subcutaneous (SAT) fat, respectively. (F) KEGG pathway and Reactome analyses of the 216 downregulated genes in zebrafish vAT and human SAT compared with eAT. Data in (D) are expressed as log2 fold change. Data in (E) and (F) are expressed as −log[P] adjusted for multiple comparisons. Data were obtained from three zebrafish eATs and vATs and four human eATs and sATs. |
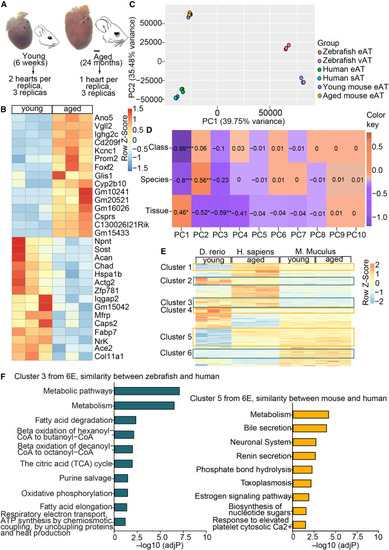
Mouse epicardial adipocytes do not share the age-related metabolic remodeling trait of human eAT (A) Schematic of RNA-seq experimental setup for young and aged mouse eAT. Arrowheads indicate the ventricular area covered by eAT. Scale bar, 1 mm. (B) Heatmap of the top 30 DEGs in young compared with aged mouse eAT. (C) PCA score plot showing clustering of adipocyte populations from zebrafish, mouse, and human based on the ranked expression of one-to-one orthologs. (D) Correlation matrix of PCs with known variables. The indicated values and color gradient correspond to the Pearson correlation coefficient (r) for each pair of variables. ∗p < 0.05, ∗∗p < 0.01, ∗∗∗p < 0.001. (E) Clustered heatmap depicting the row-normalized ranking scores of all DEGs shared by human and zebrafish eAT compared with white adipose tissue in zebrafish, human, and mouse samples. Green boxes indicate clusters where the transcription profile is most similar between human and zebrafish and yellow boxes between human and mouse. (F) Pathway enrichment analysis of gene clusters with similar expression in human and zebrafish (cluster 3) and similar expression in human and mouse (cluster 5). All pathway analyses were done using the KEGG and Reactome databases. Enrichment is expressed as the −log[P] adjusted for multiple comparisons. |
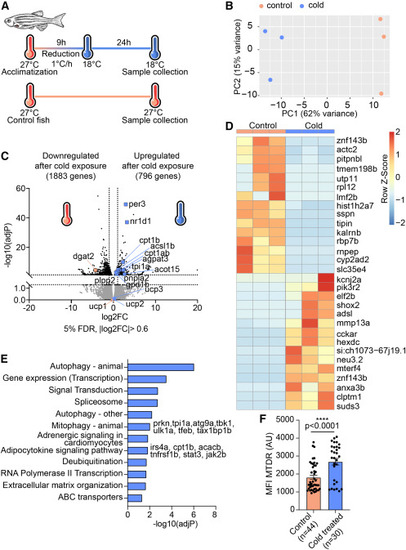
Cold exposure induces a lipid cycling and mitochondrial biogenesis transcriptomic program in zebrafish eAT (A) Schematic of cold acclimatization of adult zebrafish. (B) PCA score plot showing clustering of epicardial adipocytes according to environmental temperature. (C) Volcano plot showing DEGs of eAT in cold-exposed compared with control siblings maintained at ambient temperature. The x axis shows log2 fold change and the y axis adjusted p value on a −log10 scale. (D) Heatmap of the top 15 most differentially upregulated and downregulated genes in the eAT of cold-acclimatized fish. (E) Top enriched pathways from KEGG and Reactome analyses of the upregulated genes (796) in cold-exposed fish. (F) Bar graph depicting cold-induced elevation of active mitochondrial content in epicardial adipocytes, measured as mean fluorescent intensity of MTDR (in arbitrary units [a.u.]). Data are presented as mean ± SEM. ∗∗∗∗p < 0.0001, two-tailed t test. n indicates the number of adipocytes from 5 control and 3 cold-treated fish. |