
|
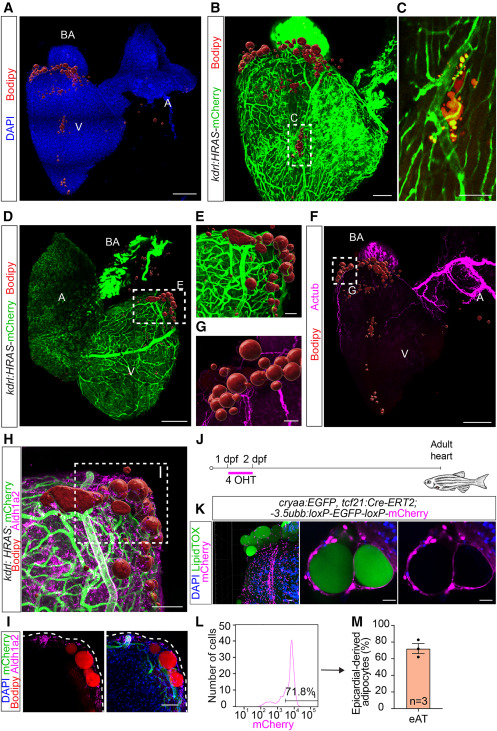
Fig. 1 Anatomical localization, subtissular niche, and epicardial origin identify a zebrafish cardiac fat depot equivalent to the mammalian eAT (A) Zebrafish eAT localizes mainly at the anterior pole of the heart. Shown is a confocal image of an adult zebrafish heart stained with BODIPY 558/568 C12 to detect lipids (adipocytes) and DAPI. Scale bar, 200 μm. (B and C) Zebrafish eAT is in contact with major coronary vessels. (B) A kdrl:Has.HRAS-mCherry zebrafish heart, immunostained for mCherry and stained with BODIPY 558/568 C12. Scale bar, 100 μm. (C) Enlargement of the boxed area in (B). Scale bar, 50 μm. (D and E) Vascularization of zebrafish eAT by underlying coronary vessels. (D) A kdrl:Has.HRAS-mCherry zebrafish heart, immunostained for mCherry and stained with BODIPY 558/568 C12. Scale bar, 200 μm. (E) Enlargement of the boxed area in (D). Scale bar, 50 μm. (F and G) Zebrafish eAT is highly innervated. (F) Heart immunostained for acetylated tubulin (Actub). Adipocytes were visualized with BODIPY 558/568 C12 staining. Scale bar, 200 μm. (G) Digitally traced nerves from the boxed area in (F). Scale bar, 50 μm. (H and I) The fat depot is located underneath the epicardium. (H) Adult kdrl:Has.HRAS-mCherry zebrafish heart, immunostained for the epithelial marker Aldh1a2 and mCherry. Adipocytes were visualized with BODIPY 558/568 C12 staining. Scale bar, 50 μm. (I) A single confocal plane of the boxed region in (H). Scale bar, 50 μm. (J and K) Epicardial origin of zebrafish eAT. (J) Schematic of the epicardial linage tracing approach. 4-OHT-mediated induction of Cre recombination in tcf21:Cre-ERT2; ubb:loxP-EGFP-loxP-mCherry fish at 1–2 days post fertilization (dpf) enabled labeling of cells derived from tcf21+ proepicardial cells in the adult heart. (K) Epicardium-derived cells were visualized by mCherry immunostaining and adipocytes by LipidTOX. DAPI labeled all cell nuclei in the heart. Scale bar, 20 μm. (L) Representative flow cytometry plot showing distribution of tcf21:Cre-ERT2 traced cells by mCherry fluorescence intensities. (M) Graph showing average percentage of mCherry+ epicardium-derived adipocytes in the zebrafish heart. V, ventricle; A, atrium; BA, bulbus arteriosus. Adipocytes in (A), (B), and (D)–(H) are shown as 3D surface-rendered objects. All images represent observations from 3 animals per group.