
Fig. 3
- ID
- ZDB-FIG-240513-32
- Publication
- Morocho-Jaramillo et al., 2024 - The zebrafish heart harbors a thermogenic beige fat depot analog of human epicardial adipose tissue
- Other Figures
- All Figure Page
- Back to All Figure Page
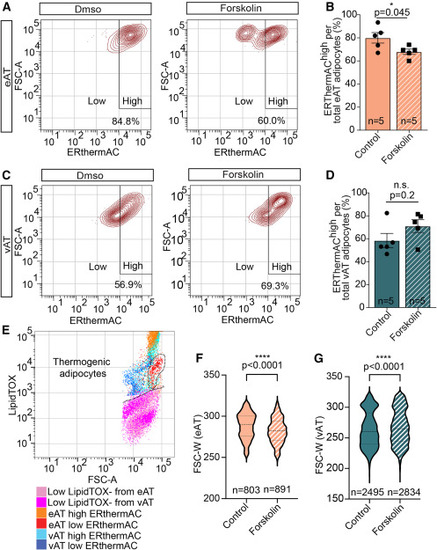
Heterogeneity of thermogenic activity, fueled by lipolysis in zebrafish eAT (A) Representative contour plots of flow cytometry analysis revealing a forskolin-stimulated ERthermAClow population in zebrafish eAT. (B) Bar graph displaying a reduction of ERthermAChigh adipocytes in the eAT following forskolin exposure. (C) Contour plots showing no detectable shift of intensity of ERthemAC by flow cytometry in the vAT adipocytes treated with forskolin compared with control solution-treated ones. (D) Bar graph showing unaltered percentages of ERthemAChigh adipocytes in the vAT following forskolin exposure compared with controls. (E) Dot plot showing lower lipid content (stained with LipidTOX) following forskolin stimulation in ERthemAClow (thermogenic) compared with ERthemAChigh (non-thermogenic) adipocytes from eAT but not vAT. A dashed line encircles the thermogenic eAT population. (F and G) Violin plots showing size distribution of epicardial (F) and abdominal (G) adipocytes before and after forskolin treatment. Middle lines indicate the median, and lower and upper lines indicate the first and third quartile, respectively. Data in (B) and (D) are presented as mean ± SEM. ∗p < 0.05, ∗∗∗∗p < 0.0001, two-tailed t test. n indicates number of animals (B and D) or number of cells from three fish per condition (F and G). |