FIGURE SUMMARY
Title

Influence of two anti-tumor drugs, pazopanib, and axitinib, on the development and thyroid-axis of zebrafish (Danio rerio) embryos/larvae

Authors
Yang, L., Tu, P.H., Zhang, C.X., Xie, R.R., Dong, M., Jing, Y., Chen, X., Wei, G., Song, H.D.
Source
Full text @ Front Endocrinol (Lausanne)

Developmental toxicities and survival of zebrafish embryos following exposure to different concentrations (0, 10, 50, 100 nM) of pazopanib and axitinib for 96 (h) (A, B) Dead embryos, (C, D) hatchability and larval survival rates, (E, F) time to hatching (days), and (G, H) body length (mm). Relative thyroid follicle numbers were analyzed from D-F. Data are expressed as the mean ± SD, n = 3 (48 embryos per concentration, with three replicates). Different letters indicate a statistically significant difference between groups, P < 0.05, One-way ANOVA test followed by Tukey’s multiple comparison.

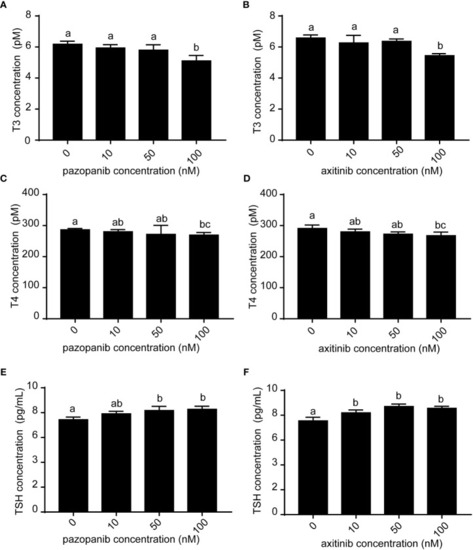
Levels of T3, T4, and TSH in zebrafish embryos following exposure to different concentrations (0, 10, 50, 100 nM) of pazopanib and axitinib for 96 h. (A, C, E) represent pazopanib toxicity, and (B, D, F) represent axitinib toxicity. Relative thyroid follicle numbers were analyzed from (D-F). Data are expressed as the mean ± SD, n = 3 (20 embryos per concentration, with three replicates). Different letters indicate a statistically significant difference between groups, P < 0.05, One-way ANOVA test followed by Tukey’s multiple comparison.

Whole-mount in situ hybridization (WISH) of tg and tshβ in zebrafish embryos following exposure to 100 nM of pazopanib and axitinib for 96 h (A) WISH of tg. (B) The relative reduction in thyroid area (%). (C) WISH of tshβ. (D) Relative reduction in thyroid area (%). Data are expressed as the mean ± SD, n = 3 (20 embryos per concentration, with three replicates). Different letters indicate a statistically significant difference between groups, P < 0.05, One-way ANOVA test followed by Tukey’s multiple comparison.

Morphology and histopathology of the thyroid in zebrafish embryos following exposure to 100 nM of pazopanib and axitinib for 96 h (A) Confocal imaging analyses of the thyroid in transgenic Tg (tg: EGFP) embryos. (B) The relative reduction in thyroid volume (%) from (A, D-F) H&E staining of zebrafish embryos. (C) The size of the follicles was analyzed from D-F. (G) Relative thyroid follicle numbers were analyzed from D-F. Data are expressed as the mean ± SD, n = 6. Different letters indicate a statistically significant difference between groups, P < 0.05, One-way ANOVA test followed by Tukey’s multiple comparison.

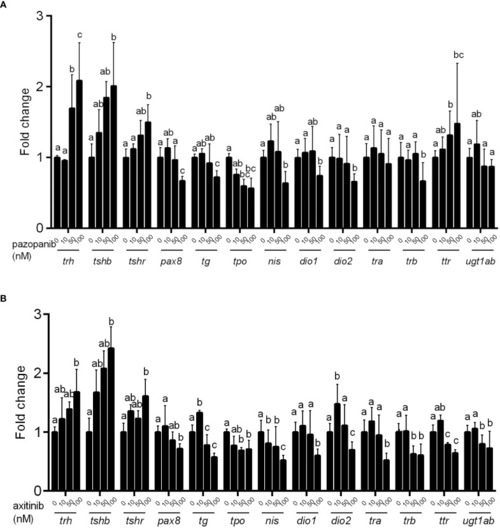
Relative expression of hypothalamic–pituitary–thyroid (HPT) axis related genes in zebrafish embryos following exposure to different concentrations (0, 10, 50, 100 nM) of pazopanib and axitinib for 96 h. (A, B) for pazopanib and axitinib, respectively. Data are expressed as the mean ± SD, n = 6 (60 embryos per concentration, with three replicates). Different letters indicate a statistically significant difference between groups, P < 0.05, One-way ANOVA test followed by Tukey’s multiple comparison.

Influence of two tyrosine kinase inhibitors on development and the thyroid system in zebrafish embryos. Pazopanib and axitinib were found to have notable toxic effects on the development and survival of zebrafish embryos, which is closely associated with disordered thyroid function. This figure was modified using Figdraw and PowerPoint.

Acknowledgments
This image is the copyrighted work of the attributed author or publisher, and ZFIN has permission only to display this image to its users. Additional permissions should be obtained from the applicable author or publisher of the image. Full text @ Front Endocrinol (Lausanne)