Knock-in pipeline and characterization of knock-in line at the <italic toggle='yes'>krt92</italic> locus.

(A) Schematic representation of the 3′ knock-in pipeline with 5′ modified dsDNA as the donor. The iCre indicates improved Cre. (B) The design of the template vector, PCR-amplified dsDNA with 5′ modifications, and the gRNA sequence for the construction of TgKI(krt92-p2A-EGFP-t2A-CreERT2). The gRNA1 and gRNA2 indicate in vivo linearization sites (sequences listed in Table S2). The pink lollipops in the middle of long LHA indicate synonymous point mutations on the left HAs. The orange lollipops at the end of dsDNAs indicate 5′ AmC6 modifications. The nucleotide sequence in blue indicates gRNA; whereas the nucleotide sequence in red indicates the PAM sequence. (C, D, E) Summary statistics of krt92 knock-in efficiency using different donors, including the percentage of injected F0 with at least 30% fluorescence labelling in the skin (C), the percentage of adult F0 giving rise to germline transmission (D), and the percentage of F1 siblings from four different founders (Fish 1–4) carrying the knock-in cassette (E). (F) The scheme for the lineage-tracing strategy for the iCre or tamoxifen-inducible Cre knock-in lines. There are two alternatives for the color switch using the Cre responder lines, option 1 contains ubb:loxp-CFP-stop-loxp-H2BmCherry transgene (abbreviated as ubi:CSHm), whereas option two contains ubb:loxp-EGFP-stop-loxp-mCherry (abbreviated as ubi:Switch). Cells with Cre recombination will ubiquitously express H2BmCherry or mCherry. (G, H, I, J) Temporal labelling with 20 μM 4-OHT treatment at 6–26 hpf in TgKI(krt92-p2A-EGFP-t2A-CreERT2);Tg(ubi:CSHm) line (G); and representative confocal images at 2 dpf (H–H’’), 3 dpf (I–I’’), and 6 dpf (J–J’’). Skin cells with Cre recombination after 4-OHT treatment were labelled with H2BmCherry. The insets are magnified views showing the expression pattern of two fluorescent proteins. Scale bars = 200 μm.

The design and characterization of knock-in lines at the <italic toggle='yes'>nkx6.1</italic> locus.

(A) The design of donor dsDNA template and gRNA sequence for the construction of knock-in lines at the 3′ end of the nkx6.1 locus. The nucleotide sequence in blue indicates gRNA; whereas the nucleotide sequence in red indicates the PAM sequence. The bottom panel shows the sequences of LHA and RHA. (B, C, D) Summary statistics of nkx6.1 knock-in efficiency, including the percentage of injected F0 with observable fluorescence labelling in the hindbrain and spinal cord (B), the percentage of adult F0 giving rise to germline transmission (out of those that bred) (C) and the percentage of F1 siblings inheriting each allele (D). (E, F, G) Representative confocal images of TgKI(nkx6.1-p2A-mNeonGreen-t2A-iCre);Tg(ubi:CSHm) at 1 (E), 2 (F), and 3 dpf (G). Cells expressing mNeonGreen indicate nkx6.1+ cells; all progenies of nkx6.1+ cells were labelled with H2BmCherry. The insets are magnified views showing the expression pattern of two fluorescent proteins. (H) Representative confocal image of lineage-tracing results in the principal islet of the pancreas in the TgKI(nkx6.1-p2A-mNeonGreen-t2A-iCre);Tg(ubi:CSHm) line at 6 dpf. Cells in white shown in H are β-cells with Insulin staining, whereas cells in green in H’’ are α-cells with Glucagon staining. (E, F, G, H) Scale bars = 200 μm (E, F, G) or 20 μm (H).

<italic toggle='yes'>nkx6.1</italic><sup>+</sup> cells were gradually restricted to the duct and gave rise to secondary islets in the zebrafish pancreas.

(A) Experimental timeline for temporal labelling using short-term and long-term lineage tracing. 4-OHT (20 μM) was added at the 6 or 8 somite stage and the treatment continued until 36 hpf for short-term lineage tracing. (B, C, E, F, G, H) (B, B’, C, C’) 4-OHT (20 μM) was added from 1–2 dpf and confocal imaging was performed at 60 dpf for the long-term lineage tracing (E, F, G, H). Representative confocal images of the pancreas at 6 dpf in TgKI(nkx6.1-p2A-EGFP-t2A-CreERT2; ptf1α:EGFP);Tg(ubi:CSHm). The progenies of nkx6.1+ cells after 4-OHT treatment were H2BmCherry positive. The EGFP signals indicate acinar cells. Intrapancreatic ductal cells were demonstrated by membrane staining using the anti-Vasnb antibody (shown in white). The region within the yellow dashed line in B indicates H2BmCherry+/EGFP+ enrichment. Arrowheads in (B’, C, C’) point to H2BmCherry+/EGFP+/Vasnb cells, both indicating acinar cells from nkx6.1+ cell origin. For each condition, we scanned five samples with 16–24 single-planes for larval pancreata and 18–30 single planes for juvenile pancreata. (B, C) The Z-stacked images were displayed (B, C) demonstrating a large number of mCherry+/EGFP+ cells with 4-OHT treatment starting from six-somite stage, whereas the number of double positive cells are decreased with statistical significance. (D) The quantification and statistical results of EGFP/mCherry double positive cells with 4-OHT treatment starting at 6 and 8 somite stages. Two-tailed t test was used for statistical analysis, with P-value < 0.05 considered as statistically significant. (E, F, G, H) Projection images of lineage-traced secondary islets in the TgKI(nkx6.1-p2A-EGFP-t2A-CreERT2);Tg(ubi:CSHm) zebrafish pancreas at 60 dpf. The progenies of nkx6.1+ cells after the 4-OHT 1–2 dpf treatment were H2BmCherry positive. (E) The selected area in the white dashed square in (E) was magnified in a single plane (E’, E’’). (E) The cyan dashed lines outline the pancreas (E). (E, F, G, H) Split channels of (E) are displayed for clarity (F, G, H). Arrowheads point to lineage-traced β-cells in the secondary islet co-stained with an anti-Insulin antibody. (B, C, E, F, G, H) Scale bars = 80 μm (B, B’, C, C’), 20 μm (E, F, G, H), or 10 μm (E’, E’’), respectively.

The design and characterization of knock-in lines at the <italic toggle='yes'>krt4</italic> locus.

(A) The design of donor dsDNA templates and gRNA sequence for the construction of knock-in lines at the 3′ end of the krt4 locus. The nucleotide sequence in blue indicates gRNA, whereas the nucleotide sequence in red indicates the PAM sequence. The bottom panel shows the sequences of LHA and RHA. (B, C, D) Summary statistics of knock-in efficiency at the krt4 locus, including the percentage of injected F0 with fluorescence labelling on approximately one-third of their skin. (B, C, D) Knock-in mosaicism (B), the percentage of adult F0 giving rise to germline transmission (C), and the percentage of F1 siblings carrying the knock-in cassettes (D). (E, F, G, H) Representative confocal images of TgKI(krt4-p2A-mNeonGreen-t2A-iCre);Tg(ubiCSHm) at 1 dpf (E, E’, E’’), 2 dpf (F, F’, F”), 3 dpf (G, G’, G’’), and 6 dpf (H, H’, H’’). Skin and intestinal epithelial cells (at 3 and 6 dpf) were broadly recombined and labelled with H2BmCherry. (H) The white dashed lines outline the intestinal bulb (H, H’, H’’). Scale bars = 80 μm.

The design and characterization of knock-in lines at the <italic toggle='yes'>id2a</italic> locus.

(A) The design of the donor dsDNA template and gRNA sequence for the construction of knock-in lines at the 3′ end of the id2a locus. The nucleotide sequence in blue indicates gRNA, whereas the nucleotide sequence in red indicates the PAM sequence. The bottom panel shows the sequences of LHA and RHA. (B, C, D) Summary statistics of id2a knock-in efficiency, including the percentage of injected F0 with observable fluorescence labelling in the hindbrain, spinal cord, and olfactory organs (B), the percentage of adult F0 giving rise to germline transmission (C), and the percentage of F1 siblings carrying the knock-in cassettes (D). (E, F, G) Representative confocal images of TgKI(id2a-p2A-mNeonGreen-t2A-iCre); Tg(ubi:CSHm) at 2 dpf (E, E’, E’’), 3 dpf (F, F’, F’’), and 6 dpf (G, G’, G’’). Cells that are mNeonGreen positive indicate id2a-expressing cells, whereas the progenies of the id2a lineage were mCherry labelled. (H, I) Representative confocal images of lineage-tracing experiments in the zebrafish larval pancreata (H, H’, H’’, H’’’), intestine (H, H’, H’’, H’’’), and liver (I, I’) in the TgKI(id2a-p2A-mNeonGreen-t2A-iCre);Tg(ubi:CSHm) line. We scanned five pancreata and livers, with 26–34 single planes imaged. Cells in cyan are α-cells based on anti-Glucagon antibody staining. (E, F, G, H, I) Scale bars = 200 μm (E, F, G) or 80 μm (H, I).

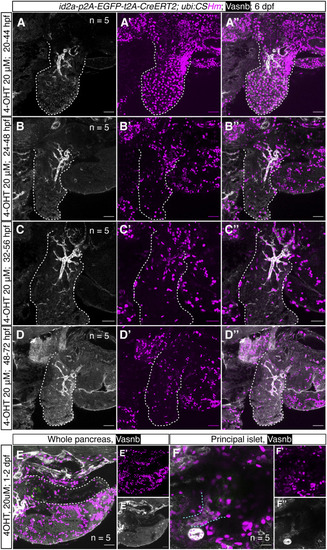
Temporally controlled <italic toggle='yes'>id2a</italic> lineage-tracing experiments in the zebrafish liver and pancreas.

(A, B, C, D) Representative confocal images of the liver in TgKI(id2a-p2A-EGFP-t2A-CreERT2) treated with 20 μM 4-OHT at 20 hpf (A, A’, A’’), 24 hpf (B, B’, B’’), 32 hpf (C, C’, C’’), and 38 hpf (D, D’, D’’) for 24 h. For each condition, we scanned five embryos; for each embryo, 20–32 single planes were imaged. The progenies of id2a+ cells were labelled with H2BmCherry. The white dashed lines indicate the liver. (E, F) Representative confocal images of zebrafish pancreas and principal islet at 6 dpf treated with 4-OHT 20 μM at 1–2 dpf. (F’, F’’) Magnified confocal images of (F) showing zebrafish principal islets. Extrapancreatic ductal cells and the principal islet are defined by anti-Vasnb antibody (in white) and anti-Glucagon antibody (in green), respectively. The white dashed lines indicate the pancreas; the cyan dashed lines indicate the extrapancreatic duct. (A, B, C, D, E, F) Scale bars = 35 μm (A, B, C, D), 40 μm (E) or 20 μm (F).

<italic toggle='yes'>id2a</italic> lineage-traced cells in an extreme liver injury model.

(A) Experimental timeline of id2a lineage tracing in an MTZ/NTR-induced extreme liver injury model. (B) Representative confocal images of id2a lineage-traced cells in the extreme liver injury model. In total, we scanned five samples with 21–35 single planes in each zebrafish larvae. The white dashed lines indicate the liver, the yellow dashed lines indicate the pancreas, and the cyan dashed lines indicate the intestinal bulb. (C) Magnified image of the liver showing large numbers of regenerated hepatocytes lineage-traced back to an id2a+ cellular origin. The arrows point to clusters of regenerated hepatocytes. (B, C) Scale bars = 40 μm (B) and 20 μm (C).

Sequence information of the construct used for <italic toggle='yes'>krt92</italic> knock-in.

The sequences of different cassettes are shown using different colors. The mutated sequences in the left homologous arms are highlighted with a dark green background color. The introduction of these point mutations keeps the amino acid sequence intact without cleavage by the Cas9/gRNA complex meant to only cleave the genomic insertion site.

Chromatogram of Sanger sequencing of the genomic integrations.

Sanger sequencing of the integrations at the junction of the last exon to the integration for each of the 10 generated knock-in lines. The chromatograms display the sequences, the reverse direction, and show integrations in-frame with the endogenous gene without indels at any of the junctions.

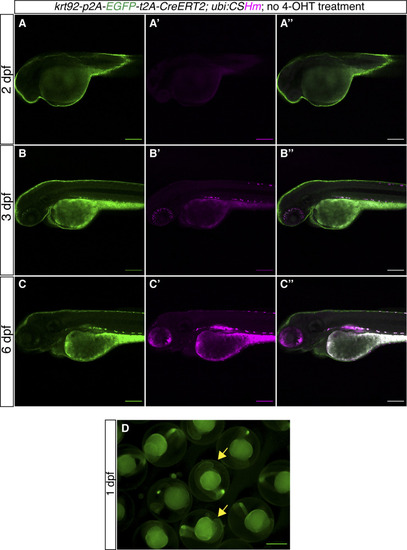
<italic toggle='yes'>TgKI(krt92-p2A-EGFP-t2A-CreERT2);Tg(ubi:CSHm)</italic> zebrafish larvae without 4-OHT treatment.

(A, B, C) Representative confocal images of live zebrafish larvae at 2 dpf (A, A’, A’’), 3 dpf (B, B’, B’’), and 6 dpf (C, C’, C’’). (A’’, B’’, C’’) are merged channels with EGFP and mCherry. The magenta signal is background appearing in pigmented cells and yolk during live imaging. There is no overlap of H2BmCherry with EGFP in the skin, indicating no leakage from residual recombination. (D) Fluorescence microscopic image of live zebrafish embryos at 1 dpf showing the appearance of green fluorescence in the skin. The yellow arrows point to fluorescence-positive embryos. (A, B, C, D) Scale bars = 200 μm (A, B, C) and 500 μm (D).

<italic toggle='yes'>TgKI(krt92-p2A-EGFP-t2A-CreERT2);Tg(ubi:CSHm)</italic> zebrafish larvae with 4-OHT temporal labelling at different timepoints.

(A, B, C) Representative confocal images of zebrafish larvae at 6 dpf showing krt92 lineage-traced cells in the intestinal bulb with 4-OHT treatment from 6–26 hpf (A, A’, A’’), 26–50 hpf (B, B’, B’’) or 56–80 hpf (C, C’, C’’). The white dashed lines outline the intestinal bulb. (D, E, F) Representative confocal images of zebrafish larvae at 6 dpf showing krt92 lineage-traced cells in the hindgut and pronephros with 4-OHT treatment from 6–26 hpf (D, D’, D’’), 26–50 hpf (E, E’, E’’) or 56–80 hpf (F, F’, F’’). The white dashed lines outline the hindgut; the cyan dashed lines outline the pronephros. The signal from the fluorescent protein was enhanced by immunostaining. Scale bars = 80 μm.

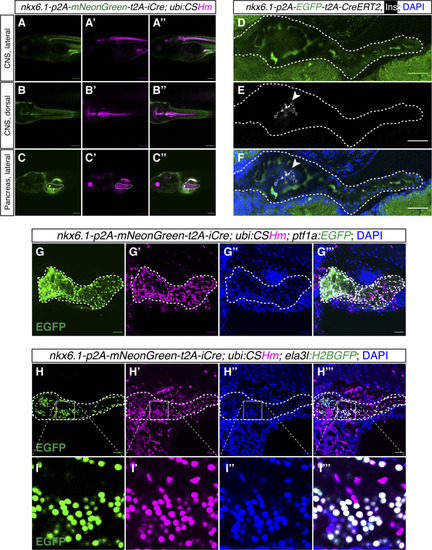
Lineage tracing and cell labelling of <italic toggle='yes'>nkx6.1</italic><sup>+</sup> cells in the CNS and pancreas.

(A, B, C) Representative confocal images of nkx6.1-expressing and lineage-traced cells in the CNS (A, A’, A’’, B, B’, B’’) and pancreas (C, C’, C’’) in zebrafish larvae at 6 dpf. (C) The white dashed lines outline the whole pancreata (C, C’, C’’). (D, E, F) Representative confocal images of nkx6.1-expressing cells in the intrapancreatic duct in 6 dpf zebrafish larvae. (D, E, F) The pancreata are outlined by white dashed lines (D, E, F). (E, F) Arrowhead points to the principal islet depicted by Insulin staining displayed in grey (E, F). (G, H, I) Representative confocal images of pancreata showing the contribution of nkx6.1-traced cells in the pancreas with acinar cells labelled with ptf1a:EGFP (G, G’, G’’, G’’’) or ela3l:H2BGFP (H, H’, H’’, H’’’) with magnifications for improved visualization (I, I’, I’’, I’’’), in 6 dpf zebrafish larvae. Low laser power was used to not visualize mNeonGreen while observing EGFP/H2BGFP. The white dashed lines outline the whole pancreata. (A, B, C, D, E, F, G, H) Scale bars = 200 μm (A, B, C) or 80 μm (D, E, F, G, H).

Chemically induced neogenesis of pancreatic endocrine cells from the <italic toggle='yes'>nkx6.1</italic><sup>+</sup> lineage.

(A, B, C, D) Representative confocal images of nkx6.1 lineage-traced cells in the whole pancreas (A, B, C, D) and principal islet (A’, B’, C’, D’) after DMSO treatment from 3 to 6 dpf. (E, F, G, H) Representative confocal images of nkx6.1 lineage-traced cells in the whole pancreas (E, F, G, H) and secondary islets (E’, F’, G’, H’) after NOTCH inhibitor (LY-411575, 1 μM) treatment from 3–6 dpf. Arrowheads point to β-cells depicted by insulin staining in the secondary islet. (I, J, K, L) Representative confocal images of nkx6.1 lineage-traced cells in the whole pancreas (I, J, K, L) and secondary islets (I’, J’, K’, L’) after REST inhibitor (X5050, 5 μM) treatment from 3–6 dpf. Arrowheads point to α-cells depicted by glucagon staining in the secondary islet. (A, B, C, D, E, F, G, H, I, J, K, L) The white dashed lines outline the whole pancreas (A, B, C, D, E, F, G, H, I, J, K, L). (A, B, C, D, E, F, G, H, I, J, K, L) The selected areas in cyan dashed squares in (D, H, L) were magnified in split channels (A’, B’, C’, D’, E’, F’, G’, H’, I’, J’, K’, L’). (M, N, O) Quantification of the number of secondary islet (M), β-cells in the secondary islets (N), and α-cells in the secondary islets (O) after DMSO, LY-411575 (1 μM) or X5050 (5 μM) treatment from 3–6 dpf. Low laser power was used to not visualize EGFP while observing gcg. (A, B, C, D, E, F, G, H, I, J, K, L) Scale bars = 80 μm (A, B, C, D, E, F, G, H, I, J, K, L) or 10 μm (A’, B’, C’, D’, E’, F’, G’, H’, I’, J’, K’, L’).

Further characterization of <italic toggle='yes'>nkx6.1</italic><sup>+</sup> lineage-traced cells.

(A, B, C) Representative lateral and dorsal confocal images of nkx6.1+ lineage-traced cells in the CNS in zebrafish larvae at 6 dpf after treatment with 4-OHT at 20 μM from 1–2 dpf. (D) Quantification of the long-term lineage-traced β-cells displayed in Fig 3E–H. We randomly selected three secondary islets from each juvenile zebrafish and pooled the results of five juveniles together; the total number of counted mCherry/ins double-positive cells was 367, whereas the total number of ins-positive cells was 562.

<italic toggle='yes'>TgKI(nkx6.1-p2A-EGFP-t2A-CreERT2);Tg(ubi:CSHm)</italic> zebrafish larvae without 4-OHT treatment.

(A, B, C) Representative confocal images of live zebrafish larvae at 2 dpf (A, A’, A’’), 3 dpf (B, B’, B’’), and 6 dpf (C, C’, C’’). (A’’, B’’, C’’) are merged channels with EGFP and mCherry. The magenta signal is background appearing in pigmented cells and yolk during live imaging. There is no overlap of H2BmCherry with EGFP in the CNS, indicating no leakage from residual recombination. Scale bars = 200 μm.

<italic toggle='yes'>TgKI(krt4-p2A-EGFP-t2A-CreERT2);Tg(ubi:CSHm)</italic> zebrafish larvae without 4-OHT treatment.

(A, B, C) Representative confocal images of live zebrafish larvae at 1 dpf (A, A’, A’’), 2 dpf (B, B’, B’’) and 3 dpf (C, C’, C’’). (A’’, B’’, C’’) are merged channels with EGFP and mCherry. The magenta signal is nuclear (H2BmCherry) and overlapping with EGFP in the skin, indicating leakage from residual recombination in a tissue with very high krt4 expression. The magenta signal in pigmented cells and yolk is background appearing during live imaging. (D) Fluorescence microscopic image of live zebrafish embryos at 2 dpf showing the appearance of green fluorescence in the skin. The yellow arrows point to fluorescence-positive embryos. (A, B, C, D) Scale bars = 200 μm (A, B, C) and 500 μm (D).

The comparisons of <italic toggle='yes'>Tg(krt4:EGFP-Mmu.Rpl10a)</italic> and <italic toggle='yes'>TgKI(krt4-p2A-EGFP-t2A-CreERT2)</italic> in intestinal bulb and hindgut.

(A, B, C, D) Representative confocal images of krt4-positive cells in the intestinal bulb and the hindgut (shown in green) together with krt4 HCR3.0 in situ hybridization (shown in magenta) in Tg(krt4:EGFP-Mmu.Rpl10a) (A, B) and TgKI(krt4-p2A-EGFP-t2A-CreERT2) (C, D). (A, B, C, D) The white dashed lines indicate the intestinal bulb (A, C) and hindgut (B, D). Scale bars = 80 μm.

Characterization of <italic toggle='yes'>id2a</italic><sup>+</sup> cells in CNS, pronephros, intestine, hepatic biliary system, and retina.

(A, B, C) Representative lateral and dorsal confocal images of id2a lineage-traced cells in the CNS and pronephros, with 4-OHT treatment from 1–2 dpf. (D, D’, D’’) Representative confocal images of immunostained id2a:mNeonGreen-positive and tp1:H2BmCherry-positive cells in the intestinal bulb. Arrowheads point to double-positive cells. (E, E’, E’’) Representative confocal images of immunostained id2a:mNeonGreen-positive and tp1:H2BmCherry-positive cells in the hindgut. Arrowheads point to double-positive cells. (F, F’, F’’) Representative and magnified images of id2a-p2amNeonGreen, tp1:H2BmCherry double-positive cells in the intestinal bulb. (F) The selected area in the white dashed square in (F) was magnified in split channels (F’, F’’). The white dashed lines outline the intestinal luminal structure. (G, H, I) Representative confocal images showing the id2a-positive cells in the intrapancreatic duct (G, G’, G’’), intrahepatic duct (H, H’, H’’), and extrahepatic duct (I, I’, I’’). (J) Quantification of the percentage id2a+ cells in intrahepatic duct, intermediate hepatic duct, and extrahepatic duct, respectively. (K, L) Representative confocal images of id2a-positive cells in the whole retina (K, K’, K’’) and magnified images in the retinal epithelial cells (L, L’, L’’). We scanned 3–5 zebrafish larvae for each tissue with 18–32 single-planes. (A, B, C, D, E, F, G, H, I, K, L) Scale bars = 200 μm (A, B, C, D, E) or 10 μm (F, K, L) or 40 μm (G, H, I).

<italic toggle='yes'>TgKI(id2a-p2A-EGFP-t2A-CreERT2);Tg(ubi:CSHm)</italic> zebrafish larvae without 4-OHT treatment.

(A, B, C) Representative confocal images of live zebrafish larvae at 2 dpf (A, A’, A’’), 3 dpf (B, B’, B’’), and 6 dpf (C, C’, C’’). (A’’, B’’, C’’) are merged channels with EGFP and mCherry. The magenta signal is background appearing in pigmented cells and yolk during live imaging. There is no overlap of H2BmCherry with EGFP in the CNS, liver, intestine, and pancreas, indicating no leakage from residual recombination. Scale bars = 200 μm.

t-SNE plots showing <italic toggle='yes'>id2a</italic> expression in zebrafish pancreas and intestine.

(A, B, C, D) UMAP plots representing id2a, cftr, sox9b, and onecut1 in adult zebrafish pancreas single-cell RNA-seq dataset. (E, F, G, H) UMAP plots representing id2a, cftr, best4, and otop2 in larval zebrafish intestine single-cell RNA-seq dataset.

The quantification of lineage-traced hepatic ductal cells.

(A, B, C) The percentage of lineage-traced hepatic ductal subtypes in TgKI(id2a-p2A-EGFP-t2A-CreERT2) treated with 4-OHT at 24 hpf (A), 32 hpf (B), and 48 hpf (C) for 24 h.

<italic toggle='yes'>id2a</italic> lineage-traced cells in chemically induced liver injury model.

(A) Experimental timeline of id2a lineage-tracing in a chemically induced liver injury model. (B, C, D) Representative confocal images of id2a lineage-traced cells in severe chemically induced liver injury model, with acetaminophen 10 mM and 0.5% ethanol treatment for 2 d followed by 2 d of recovery. The white dashed lines indicate the liver. Scale bars = 40 μm.

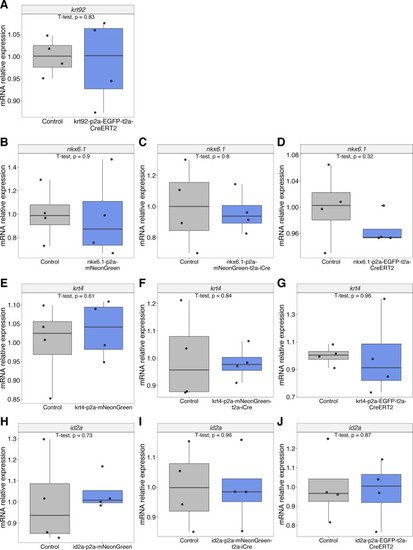
Expression of the endogenous genes in loci targeted for knock-in.

(A, B, C, D, E, F, G, H, I, J) qRT-PCR results of the relative expression of krt92 (A), nkx6.1 (B, C, D), krt4 (E, F, G), and id2a (H, I, J) in knock-in lines compared with the WT.

Acknowledgments
This image is the copyrighted work of the attributed author or publisher, and ZFIN has permission only to display this image to its users. Additional permissions should be obtained from the applicable author or publisher of the image. Full text @ Life Sci Alliance