|
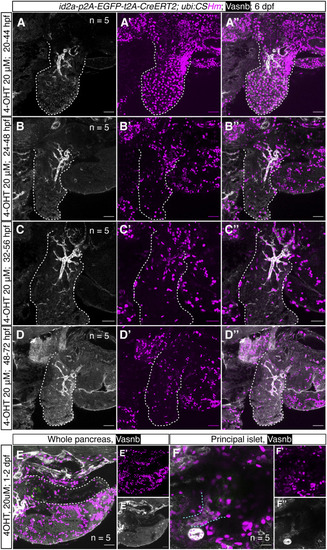
Temporally controlled <italic toggle='yes'>id2a</italic> lineage-tracing experiments in the zebrafish liver and pancreas.(A, B, C, D) Representative confocal images of the liver in TgKI(id2a-p2A-EGFP-t2A-CreERT2) treated with 20 μM 4-OHT at 20 hpf (A, A’, A’’), 24 hpf (B, B’, B’’), 32 hpf (C, C’, C’’), and 38 hpf (D, D’, D’’) for 24 h. For each condition, we scanned five embryos; for each embryo, 20–32 single planes were imaged. The progenies of id2a+ cells were labelled with H2BmCherry. The white dashed lines indicate the liver. (E, F) Representative confocal images of zebrafish pancreas and principal islet at 6 dpf treated with 4-OHT 20 μM at 1–2 dpf. (F’, F’’) Magnified confocal images of (F) showing zebrafish principal islets. Extrapancreatic ductal cells and the principal islet are defined by anti-Vasnb antibody (in white) and anti-Glucagon antibody (in green), respectively. The white dashed lines indicate the pancreas; the cyan dashed lines indicate the extrapancreatic duct. (A, B, C, D, E, F) Scale bars = 35 μm (A, B, C, D), 40 μm (E) or 20 μm (F).
|