IMAGE

Figure S4.

ID
ZDB-IMAGE-230308-12
Source
Figures for Mi et al., 2023
Image
Figure Caption

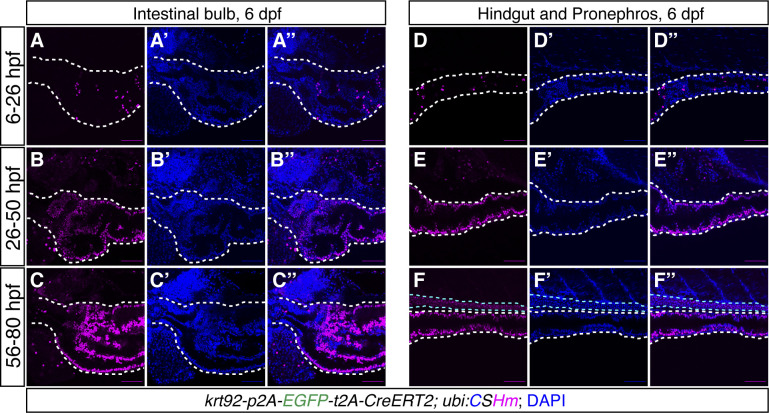
Figure S4. <italic toggle='yes'>TgKI(krt92-p2A-EGFP-t2A-CreERT2);Tg(ubi:CSHm)</italic> zebrafish larvae with 4-OHT temporal labelling at different timepoints.

(A, B, C) Representative confocal images of zebrafish larvae at 6 dpf showing krt92 lineage-traced cells in the intestinal bulb with 4-OHT treatment from 6–26 hpf (A, A’, A’’), 26–50 hpf (B, B’, B’’) or 56–80 hpf (C, C’, C’’). The white dashed lines outline the intestinal bulb. (D, E, F) Representative confocal images of zebrafish larvae at 6 dpf showing krt92 lineage-traced cells in the hindgut and pronephros with 4-OHT treatment from 6–26 hpf (D, D’, D’’), 26–50 hpf (E, E’, E’’) or 56–80 hpf (F, F’, F’’). The white dashed lines outline the hindgut; the cyan dashed lines outline the pronephros. The signal from the fluorescent protein was enhanced by immunostaining. Scale bars = 80 μm.

Acknowledgments
This image is the copyrighted work of the attributed author or publisher, and ZFIN has permission only to display this image to its users. Additional permissions should be obtained from the applicable author or publisher of the image. Full text @ Life Sci Alliance