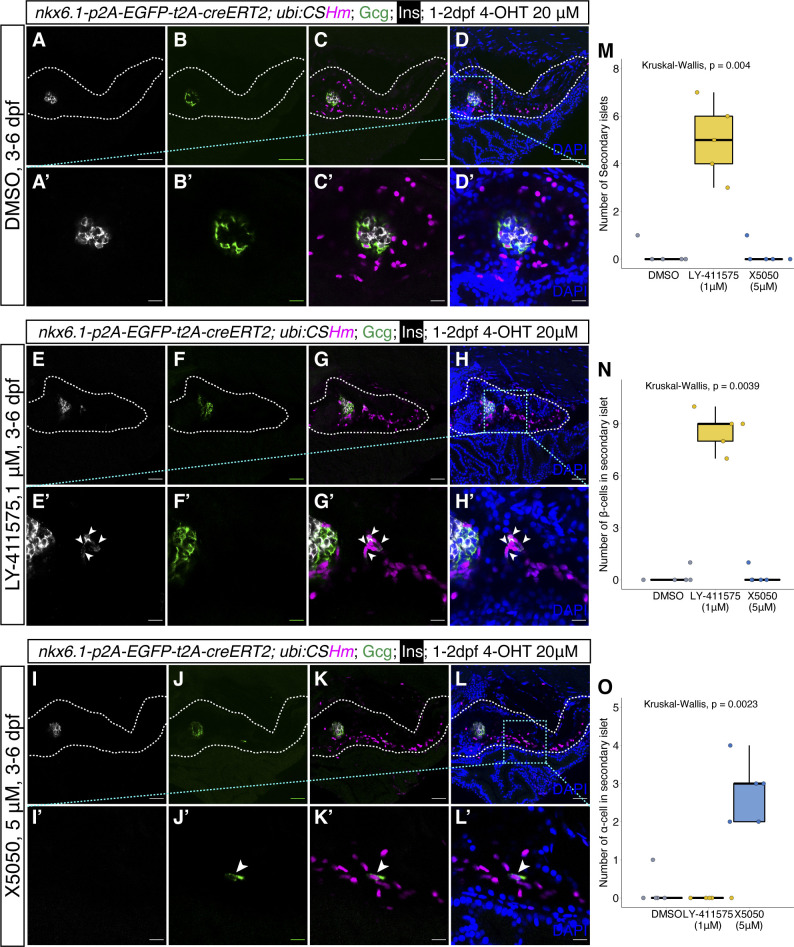
Figure Caption
Figure S6.
Chemically induced neogenesis of pancreatic endocrine cells from the <italic toggle='yes'>nkx6.1</italic><sup>+</sup> lineage.(A, B, C, D) Representative confocal images of nkx6.1 lineage-traced cells in the whole pancreas (A, B, C, D) and principal islet (A’, B’, C’, D’) after DMSO treatment from 3 to 6 dpf. (E, F, G, H) Representative confocal images of nkx6.1 lineage-traced cells in the whole pancreas (E, F, G, H) and secondary islets (E’, F’, G’, H’) after NOTCH inhibitor (LY-411575, 1 μM) treatment from 3–6 dpf. Arrowheads point to β-cells depicted by insulin staining in the secondary islet. (I, J, K, L) Representative confocal images of nkx6.1 lineage-traced cells in the whole pancreas (I, J, K, L) and secondary islets (I’, J’, K’, L’) after REST inhibitor (X5050, 5 μM) treatment from 3–6 dpf. Arrowheads point to α-cells depicted by glucagon staining in the secondary islet. (A, B, C, D, E, F, G, H, I, J, K, L) The white dashed lines outline the whole pancreas (A, B, C, D, E, F, G, H, I, J, K, L). (A, B, C, D, E, F, G, H, I, J, K, L) The selected areas in cyan dashed squares in (D, H, L) were magnified in split channels (A’, B’, C’, D’, E’, F’, G’, H’, I’, J’, K’, L’). (M, N, O) Quantification of the number of secondary islet (M), β-cells in the secondary islets (N), and α-cells in the secondary islets (O) after DMSO, LY-411575 (1 μM) or X5050 (5 μM) treatment from 3–6 dpf. Low laser power was used to not visualize EGFP while observing gcg. (A, B, C, D, E, F, G, H, I, J, K, L) Scale bars = 80 μm (A, B, C, D, E, F, G, H, I, J, K, L) or 10 μm (A’, B’, C’, D’, E’, F’, G’, H’, I’, J’, K’, L’).