IMAGE

Figure 1.

ID
ZDB-IMAGE-230308-9
Source
Figures for Mi et al., 2023
Image
Figure Caption

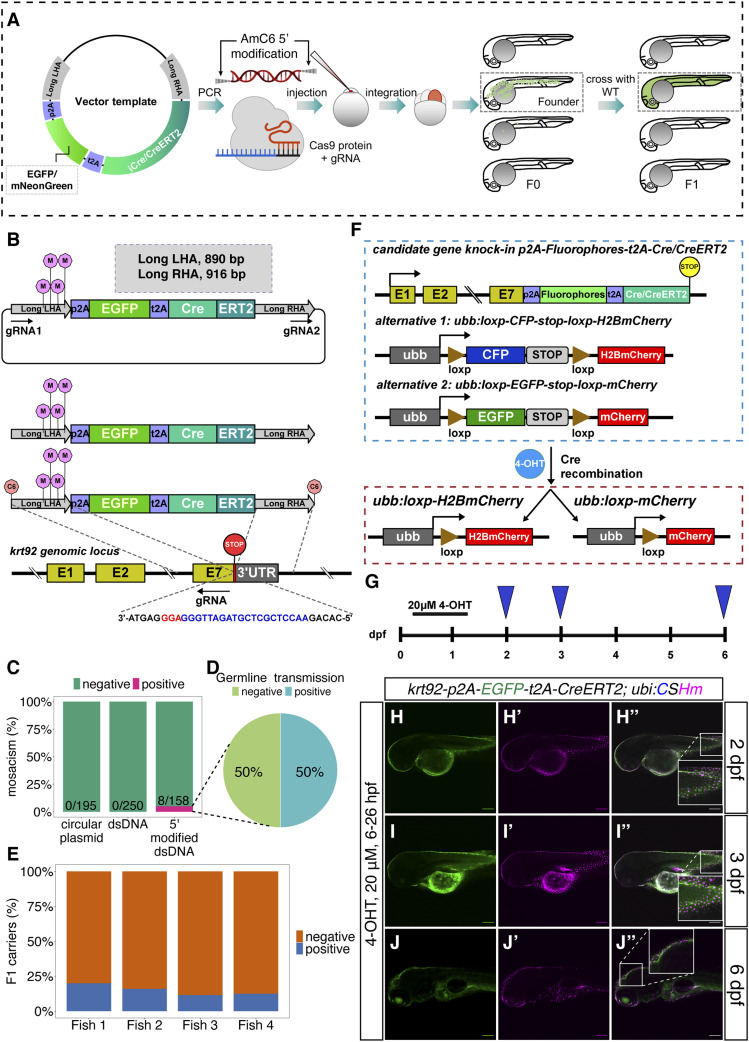
Figure 1. Knock-in pipeline and characterization of knock-in line at the <italic toggle='yes'>krt92</italic> locus.

(A) Schematic representation of the 3′ knock-in pipeline with 5′ modified dsDNA as the donor. The iCre indicates improved Cre. (B) The design of the template vector, PCR-amplified dsDNA with 5′ modifications, and the gRNA sequence for the construction of TgKI(krt92-p2A-EGFP-t2A-CreERT2). The gRNA1 and gRNA2 indicate in vivo linearization sites (sequences listed in Table S2). The pink lollipops in the middle of long LHA indicate synonymous point mutations on the left HAs. The orange lollipops at the end of dsDNAs indicate 5′ AmC6 modifications. The nucleotide sequence in blue indicates gRNA; whereas the nucleotide sequence in red indicates the PAM sequence. (C, D, E) Summary statistics of krt92 knock-in efficiency using different donors, including the percentage of injected F0 with at least 30% fluorescence labelling in the skin (C), the percentage of adult F0 giving rise to germline transmission (D), and the percentage of F1 siblings from four different founders (Fish 1–4) carrying the knock-in cassette (E). (F) The scheme for the lineage-tracing strategy for the iCre or tamoxifen-inducible Cre knock-in lines. There are two alternatives for the color switch using the Cre responder lines, option 1 contains ubb:loxp-CFP-stop-loxp-H2BmCherry transgene (abbreviated as ubi:CSHm), whereas option two contains ubb:loxp-EGFP-stop-loxp-mCherry (abbreviated as ubi:Switch). Cells with Cre recombination will ubiquitously express H2BmCherry or mCherry. (G, H, I, J) Temporal labelling with 20 μM 4-OHT treatment at 6–26 hpf in TgKI(krt92-p2A-EGFP-t2A-CreERT2);Tg(ubi:CSHm) line (G); and representative confocal images at 2 dpf (H–H’’), 3 dpf (I–I’’), and 6 dpf (J–J’’). Skin cells with Cre recombination after 4-OHT treatment were labelled with H2BmCherry. The insets are magnified views showing the expression pattern of two fluorescent proteins. Scale bars = 200 μm.

Acknowledgments
This image is the copyrighted work of the attributed author or publisher, and ZFIN has permission only to display this image to its users. Additional permissions should be obtained from the applicable author or publisher of the image. Full text @ Life Sci Alliance