
Image
|
Figure Caption
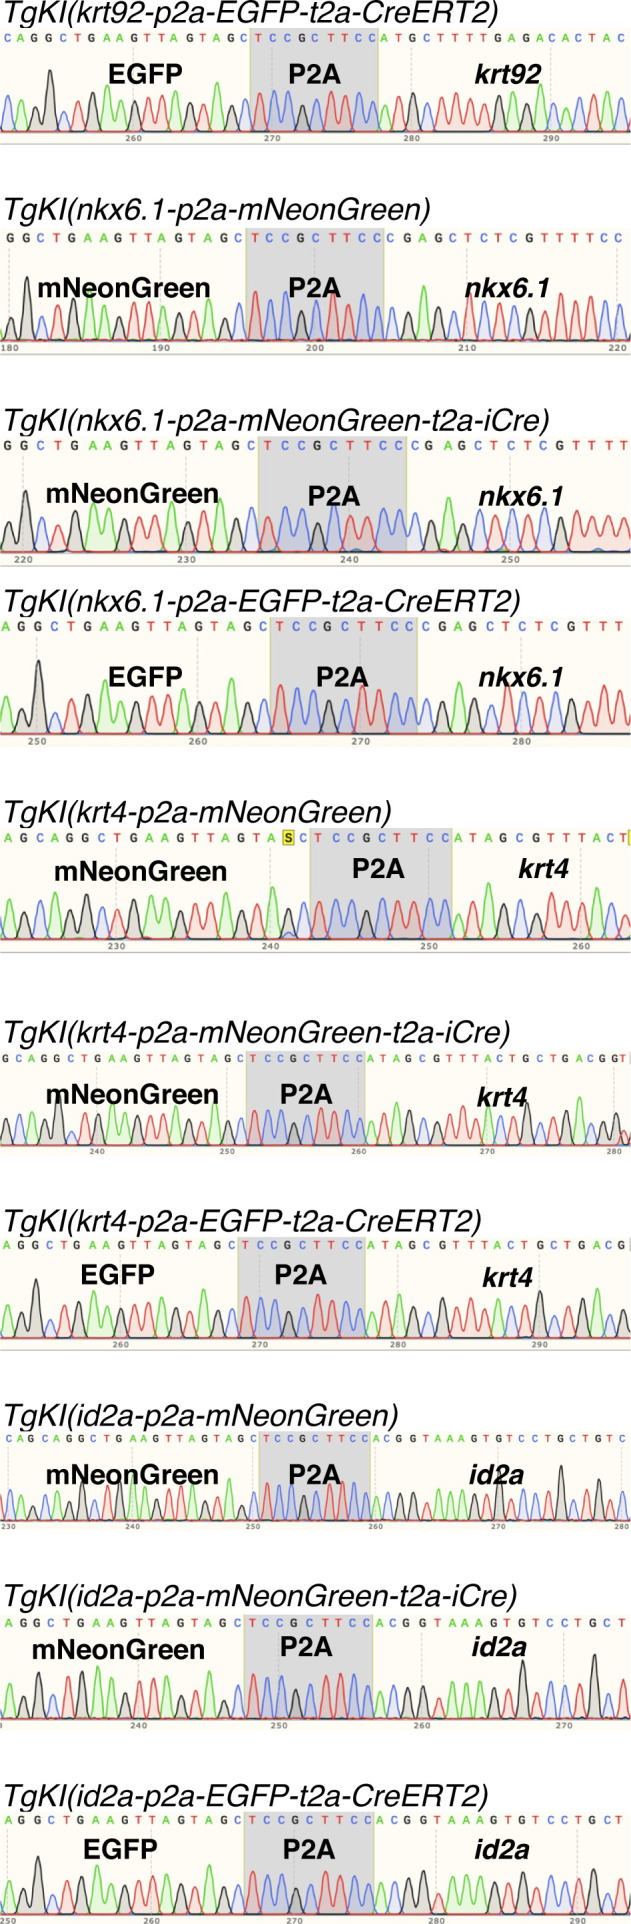
Figure S2.
Sanger sequencing of the integrations at the junction of the last exon to the integration for each of the 10 generated knock-in lines. The chromatograms display the sequences, the reverse direction, and show integrations in-frame with the endogenous gene without indels at any of the junctions.
Acknowledgments
This image is the copyrighted work of the attributed author or publisher, and
ZFIN has permission only to display this image to its users.
Additional permissions should be obtained from the applicable author or publisher of the image.
Full text @ Life Sci Alliance