- Title
-
Identification of the Time Period during Which BMP Signaling Regulates Proliferation of Neural Progenitor Cells in Zebrafish
- Authors
- Shih, H.Y., Chang, C.W., Chen, Y.C., Cheng, Y.C.
- Source
- Full text @ Int. J. Mol. Sci.
|
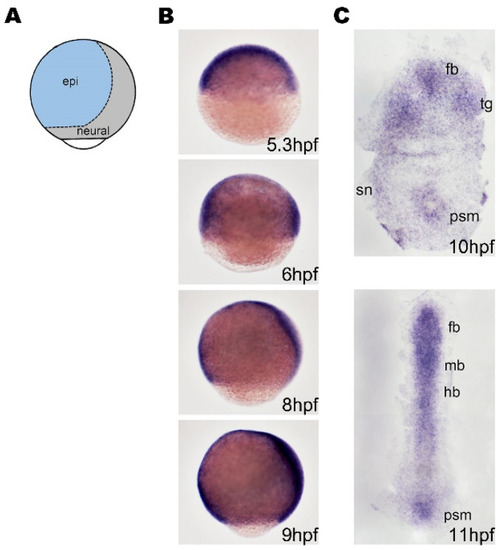
The expression of bmpr1aa during gastrulation and early segmentation. (A) A schematic illustration of the lateral view of zebrafish embryo showing the regions of neuroectoderm (neural) and surface ectoderm (epi) with dorsal to the right. (B) Zebrafish embryos were analyzed using whole-mount in situ hybridization. These images show the lateral view of the embryos with dorsal to the right and ventral to the left. (C) Dorsal view of flat-mounted embryos with anterial to the top. (B) The bmpr1aa is ubiquitously expressed before 8 hpf, and gradually expressed in neural tissue from 8 hpf. (C) bmpr1aa is expressed in developing brain at 10 hpf (end of gastrulation) and 11 hpf (early segmentation). fb, forebrain; mb, midbrain; hb, hindbrain; epi, epidermal; sn, sensory neuron; psm, presomatic mesoderm. |
|
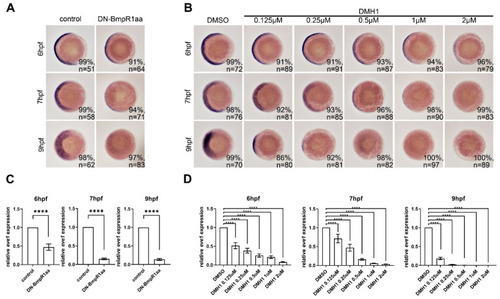
DN-Bmpr1aa and DMH1 sufficiently inhibited expression of eve1 at different time points. All panels are animal pole views with ventral to the left. Expression of eve1 was examined using in situ hybridization. (A) Tg (hsp70l:dnBmpr1aa-GFP) embryos were heat shock-treated at 5.3 hpf and harvested at 6, 7, and 9 hpf showing that eve1 expression was gradually downregulated. (B) Different concentrations of DMH1 were applied to embryos from 5.3 hpf, which inhibited eve1 expression. n, total number of embryos analyzed from three independent experiments. (C,D) qRT-PCR confirmed the expression levels of eve1 of in situ hybridization in (A,B). The percentages in each panel in (A,B) indicate the proportion of embryos displaying the same phenotype as that shown in the photographs of the total embryos examined. Quantitative data are presented as mean ± standard deviation (SD); ****, p < 0.0001. |
|
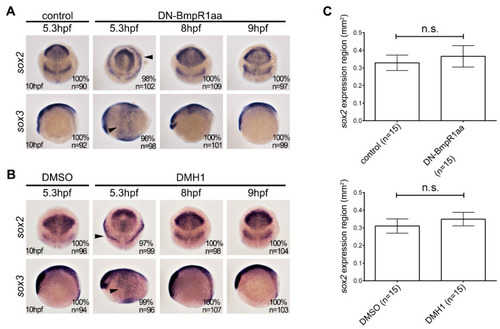
Suppression of BMP signaling after 8 hpf does not affect neural induction. In situ hybridization of heat-shock induced Tg (hsp70l:dnBmpr1aa-GFP) (A) and DMH1-treated (B) embryos analyzed at 10 hpf. The upper panels in (A,B) indicate anterior part of embryos with dorsal to the bottom, and the lower panels indicate the lateral view with anterior to the left. (A) Inhibition of BMP signaling by heatshock-induced DN-Bmpr1aa at 5.3 hpf for one hour disrupted the expression pattern and caused ectopic expression of sox2 and sox3 (arrowheads), whereas heat shock treatment after 8 hpf did not alter the expression pattern of sox2 and sox3. (B) DMH1 treatment at 5.3 for one hour phenocopies the effect of heat-shocked Tg (hsp70l:dnBmpr1aa-GFP), which is the alternating pattern and ectopic expression of sox2 and sox3. DMH1 treatment after 8 hpf had no effect on the expression pattern of sox2 and sox3. n, total number of embryos analyzed from three independent experiments. (C) sox2-expressing areas were measured using ImageJ. It should be noted that inhibiting BMP signaling using DN-Bmpr1aa or DMH1 slightly increased sox2-expressing areas; however, this was not statistically significant. n, total number of embryos analyzed from three independent experiments. The percentages in each panel in (A,B) indicate the proportion of embryos displaying the same phenotype as that shown in the photographs of the total embryos examined. Quantitative data are presented as mean ± standard deviation (SD). n.s., not significant. |
|
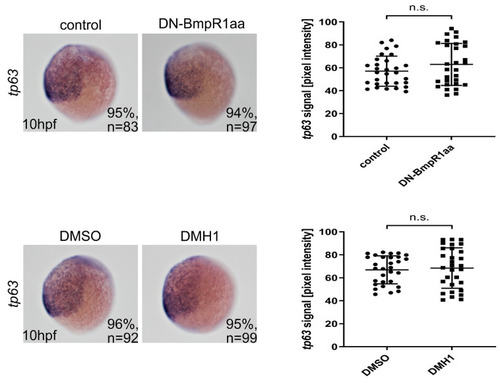
Epidermal ectoderm was unaffected after blocking BMP signaling from 8 hpf. Left panels are lateral views of embryos with ventral to the left. In situ hybridization showed no apparent change in the tp63-expressing region in BMP signal-depleted embryos from 8 hpf onward. n, total number of embryos analyzed from three independent experiments. The tp63 signals were measured using ImageJ and quantified (right panels). n, total number of embryos analyzed from three independent experiments. The percentages in each panel indicate the proportion of embryos displaying the same phenotype as that shown in the photographs of the total embryos examined. Quantitative data are presented as mean ± standard deviation (SD). n.s., not significant. |
|
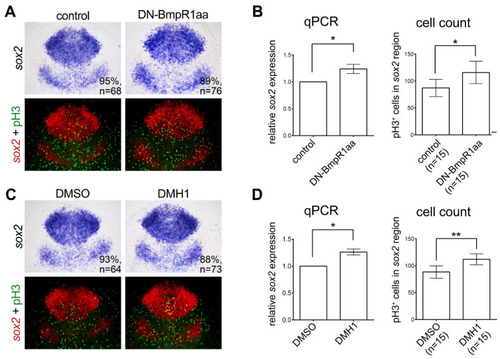
Inhibiting BMP signaling induces the proliferation of neural progenitors. (A,C) Dorsal view of flat-mounted embryos with the anterior on the top. In situ hybridization of 10 hpf embryos demonstrated increased expression of sox2 by heat shock-induced DN-Bmpr1aa (A) or DMH1 treatment (C) at 8 to 10 hpf. The upper panels in (A,C) are bright-field images and bottom panels are fluorescent images of the same; the expression of sox2 was pseudo-colored with fluorescent red and counterstained with proliferating marker phospho-histone H3 (pH3) antibody (fluorescent green) to give a better representation of the double-stained cells (fluorescent yellow). (B,D) The expression of sox2 was quantified by qRT-PCR (left panel of (B,D)). pH3-positive cells in the sox2-positive areas were manually counted and analyzed, shown on the right panel of (B,D). n, total number of embryos analyzed from three independent experiments. The percentages in each panel in (A,C) indicate the proportion of embryos displaying the same phenotype as that shown in the photographs of the total embryos examined. Quantitative data are presented as mean ± standard deviation (SD). * p < 0.05; ** p < 0.01. |
|
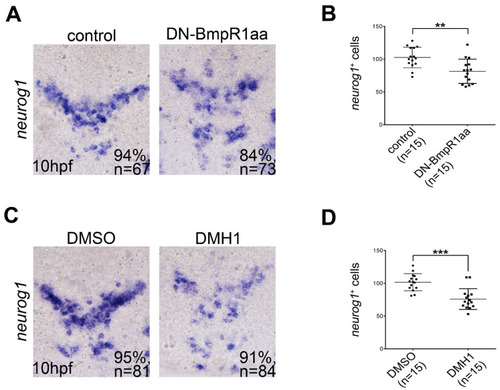
Inhibiting BMP signaling reduces the formation of neuronal precursors. All panels show dorsal views of flat-mounted embryos with the anterior on the top. (A,C) In situ hybridization of 10 hpf embryos focusing on the midbrain and hindbrain regions showing that neurog1-positive cells were reduced by heat-shock-induced DN-BmpR1aa (A) or DMH1 treatment (C) at 8 to 10 hpf. This was quantified by the cell-count analysis shown in (B,D), respectively. n, total number of embryos analyzed from three independent experiments. The percentages in each panel in (A,C) indicate the proportion of embryos displaying the same phenotype as that shown in the photographs of the total embryos examined. Quantitative data are presented as mean ± standard deviation (SD). ** p < 0.01; *** p < 0.001. |
|
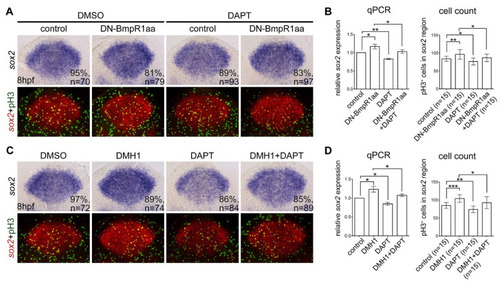
Suppressing Notch signaling abolished the upregulation of neural progenitor proliferation caused by BMP-BmpR1 inactivation (A,C) All panels are dorsal views of flat-mounted embryos at 10 hpf with the anterior on the top analyzed using in situ hybridization for sox2 expression and immunohistochemistry with phospho-histone H3 (pH3) antibody. Embryos at 8 hpf were treated with heat-shock-induced DN-BmpR1aa or treated with DHM1 for one hour. The upper panel shows bright field images and the bottom panel shows fluorescent images taken from identical embryos of the upper row; the expression of sox2 was pseudo-colored with fluorescent red and counterstained with proliferating marker pH3 (fluorescent green). (B,D) The results of in situ hybridization were confirmed by quantitative reverse transcriptase PCR (qRT-PCR) and the proliferating neural progenitors (fluorescent yellow) were subjected for cell counts (B). n, total number of embryos analyzed from three independent experiments. The percentages in each panel in (A,C) indicate the proportion of embryos displaying the same phenotype as that shown in the photographs of the total embryos examined. Quantitative data are presented as mean ± standard deviation (SD). * p < 0.05; ** p < 0.01; *** p < 0.001. |
|
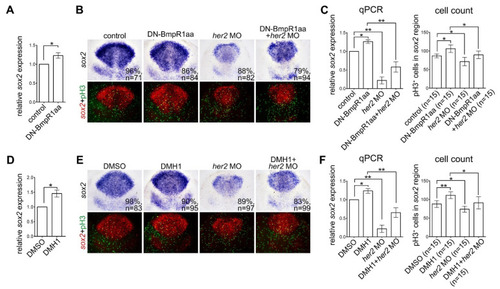
Inactivating BMP signaling upregulates neural progenitor proliferation in response to Her2 knockdown. Heat-shock treatment of Tg (hsp70l:dnBmpr1aa-GFP) or DMH1 was performed at 8–10 hpf embryos and harvested at 10 hpf. (A,D) qRT-PCR analysis demonstrated increased her2 expression by activating DN-Bmpr1aa (A) and DMH1 treatment (D). (B,E) In situ hybridization of sox2 expression demonstrating BMP inactivation by activating DN-Bmpr1aa or DMH1 treatment upregulated sox2 expression and the number of proliferating neural progenitors revealed by sox2 expression and pH3 counterstaining. Injection of her2 morpholino at the one-cell stage significantly reduced sox2 expression and the number of proliferating neural progenitors in embryos with or without BMP inactivation. (C,F) The results of in situ hybridization were confirmed by qRT-PCR, and the number of pH3-positive cells in sox2-expressing areas was counted manually. n, total number of embryos analyzed from three independent experiments. The percentages in each panel in B and E indicate the proportion of embryos displaying the same phenotype as that shown in the photographs of the total embryos examined. Quantitative data are presented as mean ± standard deviation (SD). * p < 0.05; ** p < 0.01. |

