Figure 5
- ID
- ZDB-FIG-230124-88
- Publication
- Shih et al., 2023 - Identification of the Time Period during Which BMP Signaling Regulates Proliferation of Neural Progenitor Cells in Zebrafish
- Other Figures
- All Figure Page
- Back to All Figure Page
|
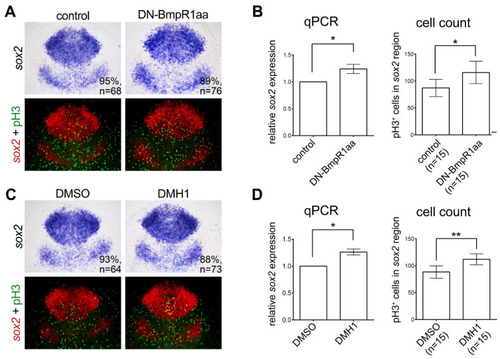
Inhibiting BMP signaling induces the proliferation of neural progenitors. (A,C) Dorsal view of flat-mounted embryos with the anterior on the top. In situ hybridization of 10 hpf embryos demonstrated increased expression of sox2 by heat shock-induced DN-Bmpr1aa (A) or DMH1 treatment (C) at 8 to 10 hpf. The upper panels in (A,C) are bright-field images and bottom panels are fluorescent images of the same; the expression of sox2 was pseudo-colored with fluorescent red and counterstained with proliferating marker phospho-histone H3 (pH3) antibody (fluorescent green) to give a better representation of the double-stained cells (fluorescent yellow). (B,D) The expression of sox2 was quantified by qRT-PCR (left panel of (B,D)). pH3-positive cells in the sox2-positive areas were manually counted and analyzed, shown on the right panel of (B,D). n, total number of embryos analyzed from three independent experiments. The percentages in each panel in (A,C) indicate the proportion of embryos displaying the same phenotype as that shown in the photographs of the total embryos examined. Quantitative data are presented as mean ± standard deviation (SD). * p < 0.05; ** p < 0.01. |

