
- Title
-
Volumetric imaging of fast cellular dynamics with deep learning enhanced bioluminescence microscopy
- Authors
- Morales-Curiel, L.F., Gonzalez, A.C., Castro-Olvera, G., Lin, L.L., El-Quessny, M., Porta-de-la-Riva, M., Severino, J., Morera, L.B., Venturini, V., Ruprecht, V., Ramallo, D., Loza-Alvarez, P., Krieg, M.
- Source
- Full text @ Commun Biol
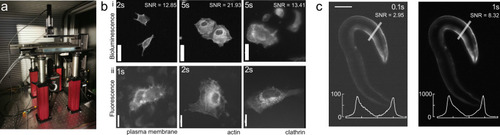
Optimized bioluminescence microscopy.
a Photograph of the optimized LowLiteScope. b Bioluminescent (i, ×20 magnification) and epifluorescent (ii, ×63 magnification) images of cell expressing the indicated marker taken on the LowLiteScope (i) or a commercial epifluorescence (ii) microscope, respectively. Exposure times indicated in the top left of each image. Scale bar = 20 μm. c Bioluminescent images of an immobilized worm expressing a turquoise-enhanced Nanolantern (TeNL) in the body wall muscle at different exposure times. Insets show the intensity profile across the line indicated in the image. Scale bar = 50 μm. |
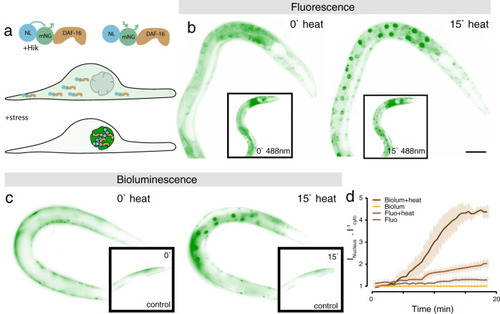
Stress reporter activation under external illumination and heat.
a, Sketch of the bioluminescent reporter. the full-length daf-16 cDNA is fused to a mNeonGreen fluorophore and a NanoLuc luciferase, called GeNL. b, c Fluorescent (b) and bioluminescent (c) DAF-16::GeNL before (0') and after (15') exposure to 37 °C heat stress. Inset shows animals at the same timepoints without external heat stress, but continuous external illumination. d Quantification of the nuclear/cytoplasmic DAF-16 ratio (Mean ± standard deviation (SD)) over 18 min of the experiment in the four tested conditions (representative for N = 5 animals). Scale bar = 40 μm. |
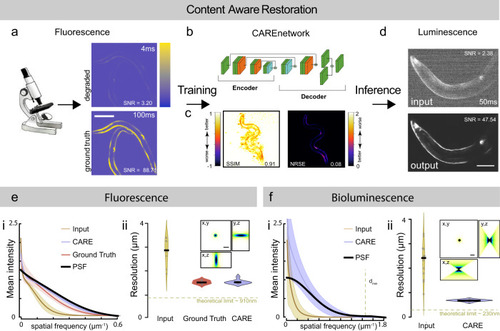
CARE training pipeline for bioluminescent images.
a Schematic of the content-aware restoration deep-learning pipeline. Pairs of images were simultaneously collected with a beamsplitter in an epifluorescent microscope at different exposure times to create a low and high-SNR training dataset. b After subpixel registration, a deep neural network is trained to restore the test image from the high-SNR ground truth. c Structural similarity (SSIM) and Normalized Root Mean Squared Error (NRMSE) of the predicted images vs the ground truth (see also Supplementary Fig. 1). d The trained network is then used to restore low-SNR bioluminescent images. Scale bar = 50 μm. e, f CARE recovers high frequency components from degraded images. Estimation of the smallest resolvable feature from the noisy fluorescence images (e), Ground truth and deep-learning predictions and the f bioluminescent images. Fluorescence images were acquired with a ×10/0.3 objective and bioluminescence images were acquired with a ×40/1.25 silicon oil objective. (i) Average azimuth intensity of the Fourier-transformed image, plotted against frequency in the 2D power spectrum image. Mean ± SD (ii) Violin plot of the smallest resolvable feature (N = 9 and 15 technical replicates (images) for each condition, respectively). Black line is the median of the distribution. Inset show the synthetic PSF calculated assuming 470 nm emission light using the Born& Wolf method81. Theoretical resolution limit was calculated according to 0.61λ/NAobjective. Scale bar = 2 μm. |
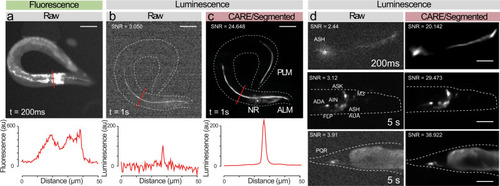
Content-aware restoration of photon-starved bioluminescent images.
a–c Suppression of autofluorescence in bioluminescent restoration microscopy. a Fluorescence picture of a worm expression mNeonGreen-enhanced Nanolantern (GeNL) in touch receptor neurons; Note the abundant autofluorescence originating from the internal tissues. b The same transgenic in bioluminescent contrast before and, c after CARE denoising. Scale bar = 50 μm. Lower panel shows intensity profile through the lines indicated in the upper micrographs. d Versatility of the neuronal reconstruction as shown on several neurons in C. elegans, such as ASH and a neuronal ensemble expressing the mTurquoise2-enhanced Nanolantern in glutamatergic neurons (eat-4p:TeNL) and PQR. Scale bar = 15–30 μm. |
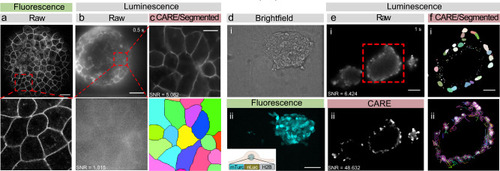
Seamless denoising and segmentation of bioluminescent zebrafish embryos and mouse embryonic stem cells.
a Laser scanning confocal fluorescence image of a 4 h post-fertilization (hpf) zebrafish embryo expressing membrane-bound GPI-GFP taken on a Leica SP5. The red box indicates the close-up below. Scale bar = 50 μm. b Unprocessed bioluminescence image of a 4 hpf zebrafish embryo expressing GPI-GFP targeted to the plasma membrane. The red square indicates the high magnification close-up below. Scale bar = 100 μm. c The same bioluminescent signal of the zebrafish embryo was restored using a pretrained CARE pipeline optimized for epithelial monolayers. The bottom picture shows the segmented bioluminescent image. No segmentation was possible on the raw image. Scale bar = 20 μm. d Brightfield (i) and fluorescence image (ii) of a spheroid of mouse embryonic stem cells. e Unprocessed raw (i) and denoised (ii) bioluminescence image of similar spheroids. Scale bar = 75 μm. f Segmented nuclei (i) after denoising, overlayed with their individual tracks throughout the timelapse (ii). Scale bar = 35 μm. |
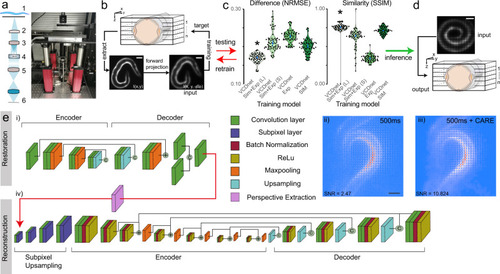
Single-exposure, volumetric bioluminescence microscopy.
a Schematic and photograph of the optimized Low-LightField microscope. (1) Sample, (2) Objective, (3) Tube lens, (4) Microlens array, (5) Relay lens, (6) camera. b–d Training pipeline to obtain fast deconvolution of 2D experimental lightfield data into 3D image stacks. b A 3D image stack was acquired on fluorescent samples representative of the bioluminescent signal in the final experiment. The stack was convolved with the lightfield PSF, to obtain a synthetic lightfield image, which was subsequently used to map onto the 3D ground-truth stack (see also Supplementary Fig. 7). The training quality of the individual models (c) was tested against unseen samples by calculating the difference and similarity to the ground truth (N = 70 images/model). The best model (indicated with an asterisk, p < 1.2e-9 compared to the 2nd best model, Wilcoxon test) with the lowest error and highest similarity was used to d reconstruct experimental bioluminescence images. Scale bars = 50 μm. Blue dots in c indicated median ± 95% confidence interval. e Pipeline for bioluminescence reconstruction. An initial (i) CARE denoising step is used to increase the SNR of (ii) noisy bioluminescent lightfield images. The individual layers are color coded according to their function. The clean images (iii) are fed into the VCD network24 (iv) after perspective extraction to reconstruct the 3D information. Scale bar = 50 μm. |
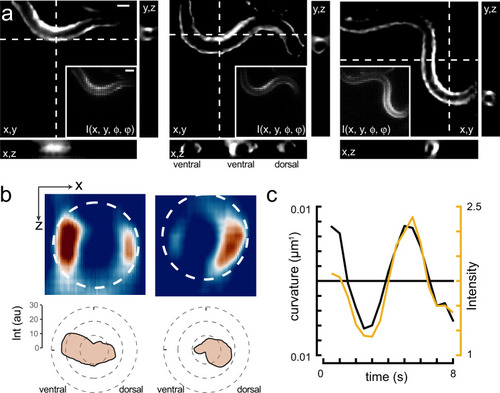
3D calcium imaging of freely moving animals.
a Sequence of reconstructed 3D images of a moving animal showing high-calcium activity at its contracted side. Images show a single plane of the reconstructed z-stack. Inset corresponds to the raw lightfield image. Scale bars = 40 μm. b Sideview image of the curvature-dependent calcium signal in muscles during ventral and dorsal body bends with warmer colors representing higher calcium signals. Scale bar = 20 μm. The polar plot shows the intensity distribution on the ventral and dorsal side. Dotted line corresponds to the circumference of the animal. c Intensity of the bioluminescent calcium indicator and curvature variation on the ventral side during animal crawling under the lightfield microscope. Black = curvature, yellow = calcium signal. |