
|
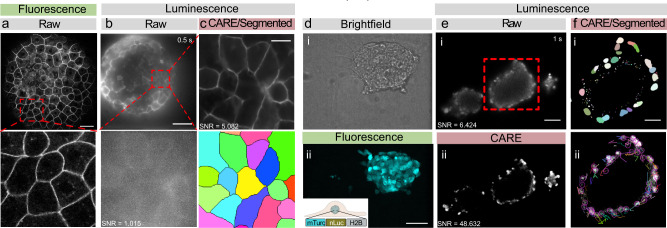
Fig. 5
a Laser scanning confocal fluorescence image of a 4 h post-fertilization (hpf) zebrafish embryo expressing membrane-bound GPI-GFP taken on a Leica SP5. The red box indicates the close-up below. Scale bar = 50 μm. b Unprocessed bioluminescence image of a 4 hpf zebrafish embryo expressing GPI-GFP targeted to the plasma membrane. The red square indicates the high magnification close-up below. Scale bar = 100 μm. c The same bioluminescent signal of the zebrafish embryo was restored using a pretrained CARE pipeline optimized for epithelial monolayers. The bottom picture shows the segmented bioluminescent image. No segmentation was possible on the raw image. Scale bar = 20 μm. d Brightfield (i) and fluorescence image (ii) of a spheroid of mouse embryonic stem cells. e Unprocessed raw (i) and denoised (ii) bioluminescence image of similar spheroids. Scale bar = 75 μm. f Segmented nuclei (i) after denoising, overlayed with their individual tracks throughout the timelapse (ii). Scale bar = 35 μm.