
|
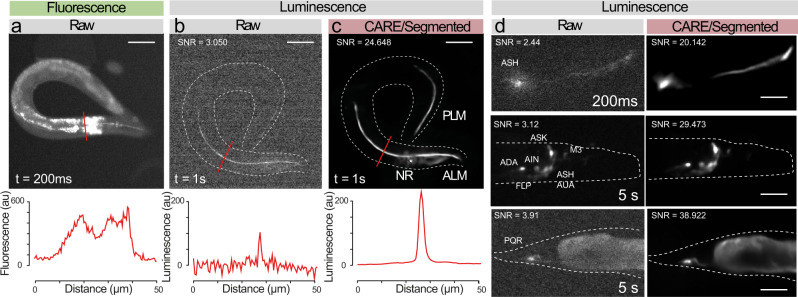
Fig. 4
a–c Suppression of autofluorescence in bioluminescent restoration microscopy. a Fluorescence picture of a worm expression mNeonGreen-enhanced Nanolantern (GeNL) in touch receptor neurons; Note the abundant autofluorescence originating from the internal tissues. b The same transgenic in bioluminescent contrast before and, c after CARE denoising. Scale bar = 50 μm. Lower panel shows intensity profile through the lines indicated in the upper micrographs. d Versatility of the neuronal reconstruction as shown on several neurons in C. elegans, such as ASH and a neuronal ensemble expressing the mTurquoise2-enhanced Nanolantern in glutamatergic neurons (eat-4p:TeNL) and PQR. Scale bar = 15–30 μm.