
- Title
-
c-myb is involved in CML progression and is a therapeutic target in the zebrafish CML model
- Authors
- Ye, Y., Yang, X., Li, F., Liu, W., Zhang, W., Huang, Z.
- Source
- Full text @ Animal Model Exp Med

Both BCR/ABL1 and c-myb overexpression can up-regulate neutrophil-related genes. (A–L) Whole-mount in situ hybridization (WISH) showed increases in lyz (A–C), mpx (D–F), npsn (G–I), and srgn (J–L) expression in Tg(hsp70:p210BCR/ABL1) and c-mybhyper at 36 hpf compared with controls. Blue arrowheads indicated lyz+, mpx+, srgn+ and npsn+ neutrophils in each row. (M–P) Quantification of numbers of 36 hpf lyz+ (M) (sibling, n = 31; c-mybhyper, n = 30; Tg(hsp70:p210BCR/ABL1), n = 16), mpx+ (N) (sibling, n = 30; c-mybhyper, n = 30; Tg(hsp70:p210BCR/ABL1), n = 15), npsn+ (O) (sibling, n = 32; c-mybhyper, n = 32; Tg(hsp70:p210BCR/ABL1), n = 22), srgn+ (P) (sibling, n = 31; c-mybhyper, n = 32; Tg(hsp70:p210BCR/ABL1), n = 14) cells. Scale bar, 200 μm; applies to panels (A–L). |

The impact of BCR/ABL1 on neutrophil regulation depends on c-myb. (A,B), (A′,B′) WISH showed an increase of c-myb expression in Tg(hsp70:p210BCR/ABL1) (B,B′) at 60 hpf compared with controls (A,A′). Red boxes showed enlarged details. (C) Quantification of numbers of 60 hpf c-myb+ cells in caudal hematopoietic tissue (CHT) (WT, n = 27; Tg(hsp70:p210BCR/ABL1), n = 37). (D,E) WISH showed a decrease of lcp1 expression in Tg(hsp70:p210BCR/ABL1) injected c-myb antisense oligonucleotide morpholino (MO) at 36 hpf. (F) Quantification of numbers of 36 hpf lcp1+ cells (Tg(hsp70:p210BCR/ABL1), n = 27; Tg(hsp70:p210BCR/ABL1) injected c-myb MO, n = 26). (G,H) SB staining showed decreased number of SB+ cells in Tg(hsp70:p210BCR/ABL1) injected c-myb MO at 3 dpf. Red boxes showed enlarged detail of SB+ cells in each group. (I) Quantification of numbers of 3 dpf SB+ cells in CHT (Tg(hsp70:p210BCR/ABL1), n = 32; Tg(hsp70:p210BCR/ABL1) injected c-myb MO, n = 12). (J,K) WISH showed a decrease of lyz expression in Tg(hsp70:p210BCR/ABL1) injected c-myb MO at 3 dpf. Red boxes showed enlarged detail of lyz+ cells in each group. (L) Quantification of numbers of 3 dpf lyz+ cells (Tg(hsp70:p210BCR/ABL1), n = 33; Tg(hsp70:p210BCR/ABL1) injected c-myb MO, n = 45). Scale bars, 200 μm (A, B, D, E, G, H, J, K) and 100 μm (A′,B′). EXPRESSION / LABELING:
PHENOTYPE:
|
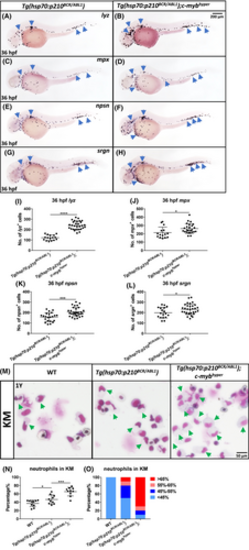
Exogenous c-myb activation can mimic CML progression in the zebrafish CML model. (A–H) WISH showed increase of lyz (A,B), mpx (C,D), npsn (E,F), and srgn (G,H) expression in Tg(hsp70:p210BCR/ABL1);c-mybhyper at 36 hpf compared with Tg(hsp70:p210BCR/ABL1). Blue arrowheads indicate lyz+, mpx+, srgn+ and npsn+ neutrophils in each row. (I–L) Quantification of numbers of 36 hpf lyz+ (I) (Tg(hsp70:p210BCR/ABL1), n = 16; Tg(hsp70:p210BCR/ABL1);c-mybhyper, n = 30), mpx+ (J) (Tg(hsp70:p210BCR/ABL1), n = 15; Tg(hsp70:p210BCR/ABL1);c-mybhyper, n = 25), npsn+ (K) (Tg(hsp70:p210BCR/ABL1), n = 22; Tg(hsp70:p210BCR/ABL1);c-mybhyper, n = 31), srgn+ (L) (Tg(hsp70:p210BCR/ABL1), n = 18; Tg(hsp70:p210BCR/ABL1);c-mybhyper, n = 32) cells. (O) May-Grünwald Giemsa staining of kidney marrow (KM) blood cells that were obtained from WT, Tg(hsp70:p210BCR/ABL1), and Tg(hsp70:p210BCR/ABL1);c-mybhyper adult zebrafish. Green arrowheads indicated neutrophils. After staining, 1000 cells were randomly chosen for further calculation. (N) The proportion of neutrophils in white blood cells in whole kidney marrow (WT, n = 10; Tg(hsp70:p210BCR/ABL1), n = 10; Tg(hsp70:p210BCR/ABL1);c-mybhyper, n = 10). (O) High proportions of neutrophils presented more in Tg(hsp70:p210BCR/ABL1);c-mybhyper than in Tg(hsp70:p210BCR/ABL1). Scale bars, 200 μm (A–H) and 50 μm (M). |

Combined treatment with flavopiridol and imatinib had a better response in Tg(hsp70:p210BCR/ABL1);c-mybhyper. (A–H) WISH of lcp1 expression in the drug-treated larvae at 4.5 dpf. After heat shock treatment, 2.5 dpf Tg(hsp70:p210BCR/ABL1) and Tg(hsp70:p210BCR/ABL1);c-mybhyper were treated for 48 h with 1‰ DMSO control, 0.1 μmol/L flavopiridol, 80 μmol/L imatinib, or 0.1 μmol/L flavopiridol combined with 80 μmol/L imatinib. (I), Quantification of numbers of 4.5 dpf lcp1+ cells in CHT (Tg(hsp70:p210BCR/ABL1) DMSO, n = 30; Tg(hsp70:p210BCR/ABL1) imatinib, n = 29; Tg(hsp70:p210BCR/ABL1) flavopiridol, n = 30; Tg(hsp70:p210BCR/ABL1) flavopiridol+imatinib, n = 29; Tg(hsp70:p210BCR/ABL1);c-mybhyper DMSO, n = 30; Tg(hsp70:p210BCR/ABL1);c-mybhyper imatinib, n = 31; Tg(hsp70:p210BCR/ABL1);c-mybhyper flavopiridol, n = 30; Tg(hsp70:p210BCR/ABL1);c-mybhyper flavopiridol+imatinib, n = 27). Scale bar, 100 μm; applies to panels (A–H). |