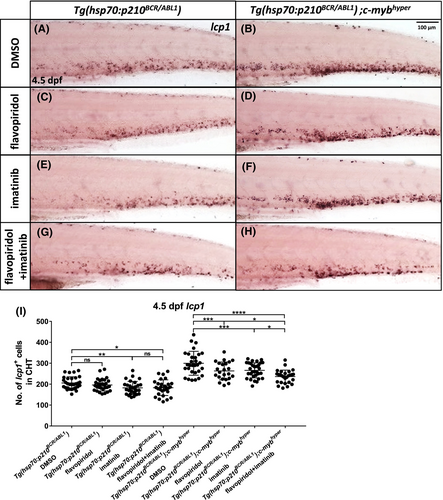
Fig. 4 Combined treatment with flavopiridol and imatinib had a better response in Tg(hsp70:p210BCR/ABL1);c-mybhyper. (A–H) WISH of lcp1 expression in the drug-treated larvae at 4.5 dpf. After heat shock treatment, 2.5 dpf Tg(hsp70:p210BCR/ABL1) and Tg(hsp70:p210BCR/ABL1);c-mybhyper were treated for 48 h with 1‰ DMSO control, 0.1 μmol/L flavopiridol, 80 μmol/L imatinib, or 0.1 μmol/L flavopiridol combined with 80 μmol/L imatinib. (I), Quantification of numbers of 4.5 dpf lcp1+ cells in CHT (Tg(hsp70:p210BCR/ABL1) DMSO, n = 30; Tg(hsp70:p210BCR/ABL1) imatinib, n = 29; Tg(hsp70:p210BCR/ABL1) flavopiridol, n = 30; Tg(hsp70:p210BCR/ABL1) flavopiridol+imatinib, n = 29; Tg(hsp70:p210BCR/ABL1);c-mybhyper DMSO, n = 30; Tg(hsp70:p210BCR/ABL1);c-mybhyper imatinib, n = 31; Tg(hsp70:p210BCR/ABL1);c-mybhyper flavopiridol, n = 30; Tg(hsp70:p210BCR/ABL1);c-mybhyper flavopiridol+imatinib, n = 27). Scale bar, 100 μm; applies to panels (A–H).
Image
Figure Caption
Figure Data
Acknowledgments
This image is the copyrighted work of the attributed author or publisher, and
ZFIN has permission only to display this image to its users.
Additional permissions should be obtained from the applicable author or publisher of the image.
Full text @ Animal Model Exp Med

