FIGURE SUMMARY
Title

Adamts10 controls transforming growth factor β family signaling that contributes to retinal ganglion cell development

Authors
Wareham, L.K., Whitener, A.E., Wu, H.J., Wu, S.Y., Mchaourab, H.S., Mortlock, D.P., Kuchtey, R.W., Kuchtey, J.
Source
Full text @ Front Mol Biosci

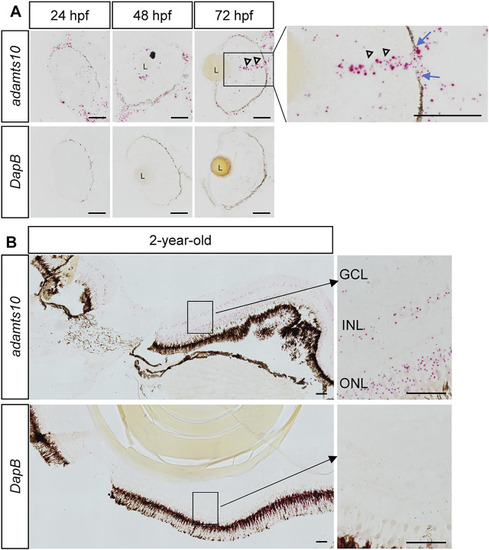
Ocular expression of adamts10 mRNA in zebrafish. (A) Expression of adamts10 mRNA (red dots, top row) was observed along the retinal pigment epithelium (dark brown/black structure) and dispersed throughout the retina of embryos at 24, 48, and 72 hpf. In 72 hpf eyes, robust signal (open arrowheads) extending from the inner retina and traversing a gap in the retinal pigmented epithelium (blue arrows, insert) is suggestive of optic nerve expression of adamts10 mRNA. (B) In 2-year-old adult eyes, expression of adamts10 mRNA was found in the outer nuclear layer (ONL), inner nuclear layer (INL), and ganglion cell layer (GCL). Hybridization probe against DapB, a bacterial gene, served as negative control on adjacent sections (bottom rows, A and B). Scale bar: 50 µm. L, Lens.

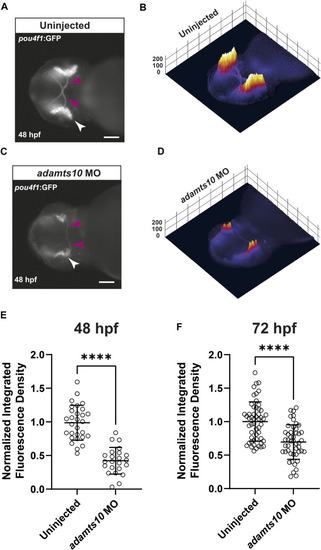
Adamts10 MO reduces pou4f1 enhancer-driven GFP fluorescence in zebrafish retinae. Representative fluorescent images of an uninjected (A) and an adamts10 MO-injected (C)Tg(pou4f1-hsp70l:GFP) embryo at 48 hpf showing pou4f1 enhancer-driven GFP fluorescence in the retina (white arrows) and optic nerves (magenta arrows, scale = 100 µm), with corresponding 3D surface plots of fluorescence intensity (B,D). (E) Normalized integrated fluorescence density of uninjected and adamts10 MO-injected embryos at 48 hpf (n = 29 and 23, respectively, ****p < 0.0001, Welch’s t-test). (F) Normalized integrated fluorescence density of uninjected and adamts10 MO-injected embryos at 72 hpf (n = 52 and n = 47, respectively, ****p < 0.0001; Welch’s t-test).

EXPRESSION / LABELING:
Gene:
Fish:
Knockdown Reagent:
Anatomical Terms:
Stage Range: Long-pec to Protruding-mouth
PHENOTYPE:
Fish:
Knockdown Reagent:
Observed In:
Stage Range: Long-pec to Protruding-mouth

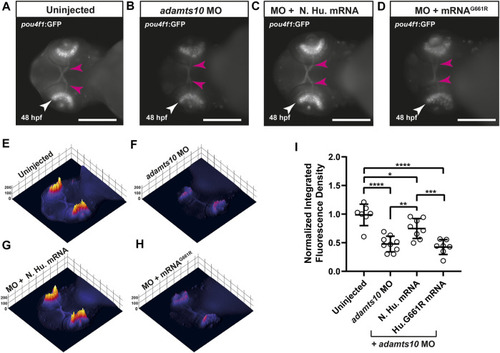
Adamts10 MO-induced reduction in pou4f1 enhancer-driven GFP expression is decreased with normal human ADAMTS10 mRNA but not ADAMTS10G661R mutant mRNA. Representative fluorescent images of a Tg(pou4f1-hsp70l:GFP) embryo uninjected (A) injected with adamts10 MO (B), co-injected with ADAMTS10 MO and normal human mRNA (C) and co-injected with adamts10 MO and ADAMTS10G661R mRNA (D), showing pou4f1 enhancer-driven fluorescence in the retina (white arrows) and optic nerve (magenta arrows); scale = 250 µm. Corresponding 3D surface plots showing fluorescence intensity for each condition (E–H). Normalized integrated fluorescence density (I) of each condition (uninjected n = 7, adamts10 MO-injected n = 9, normal human mRNA-injected n = 8 and ADAMTS10G661R mRNA n = 7, *p = 0.03, **p = 0.008,***p = 0.003, ****p < 0.0001; one-way ANOVA Tukey’s multiple comparisons test).

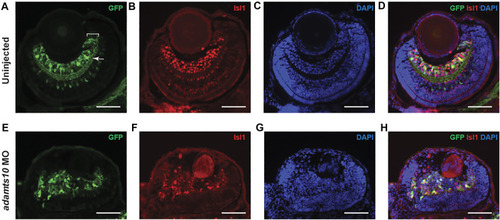
Adamts10 MO prevents proper formation of the ganglion cell layer. Representative images of stained sections from uninjected (A–D) and MO-injected (E–H)Tg(pou4f1-hsp70l:GFP) embryos at 72 hpf showing GFP staining (A,E), Isl1 staining (B,F), DAPI staining (C,G) and merged images (D,H). In A, white bracket = ganglion cell layer, white arrow = inner plexiform layer. Scale = 40 µm).

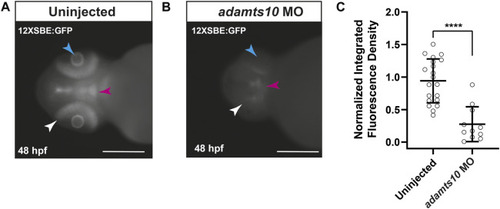
Adamts10 MO reduces pSmad3-Mediated TGFβ family signaling in zebrafish retinae. Representative fluorescent images of an uninjected (A) and adamts10 MO-injected (B)Tg(12xSBE:EGFP) embryo at 48 hpf showing fluorescence reporting of active pSmad3-mediated signaling in the retina (white arrows), brain (magenta arrows) and lens (cyan arrows, scale = 250 µm). Normalized integrated fluorescence density of uninjected, and adamts10 MO-injected Tg(12xSBE:EGFP) embryos at 48 hpf [(C), n = 21 and n = 11, respectively, ****p < 0.0001; Welch’s t-test].

EXPRESSION / LABELING:
Gene:
Fish:
Knockdown Reagent:
Anatomical Terms:
Stage: Long-pec
PHENOTYPE:
Fish:
Knockdown Reagent:
Observed In:
Stage: Long-pec

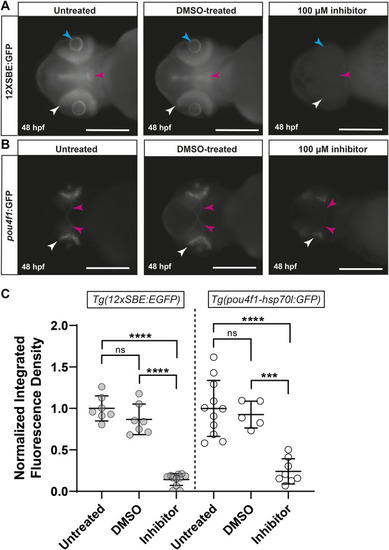
Inhibition of TGFβ signaling with SB431542 reduces pou4f1 enhancer-driven GFP expression in the retina. Representative images of untreated, DMSO-treated and SB431542-treated Tg(12xSBE:EGFP) embryos at 48 hpf (A) showing GFP fluorescence reporting of pSmad3-mediated signaling in the retina (white arrows), brain (magenta arrows) and lens (blue arrows); scale = 250 µm. Representative images of untreated, DMSO-treated and SB431542-treated Tg(pou4f1-hsp70l:GFP) embryos at 48 hpf (B) showing pou4f1 enhancer-driven GFP fluorescence in the retina (white arrows) and optic nerves (magenta arrows); scale = 250 µm. Normalized integrated fluorescence density (C) of each condition (Tg(12xSBE:EGFP); untreated: n = 7, DMSO-treated: n = 7, SB431542-treated: n = 12: ****p < 0.0001, ***p = 0.0004, ns = non-significant; Tg(pou4f1-hsp70l:GFP); untreated: n = 11, DMSO-treated: n = 5 and SB431542-treated: n = 8, ****p < 0.0001, ***p = 0.0004, ns = non-significant; one-way ANOVA Tukey’s multiple comparisons test.

Acknowledgments
This image is the copyrighted work of the attributed author or publisher, and ZFIN has permission only to display this image to its users. Additional permissions should be obtained from the applicable author or publisher of the image. Full text @ Front Mol Biosci