IMAGE

FIGURE 2

ID
ZDB-IMAGE-220924-2
Genes
Source
Figures for Wareham et al., 2022
Image
Figure Caption

FIGURE 2

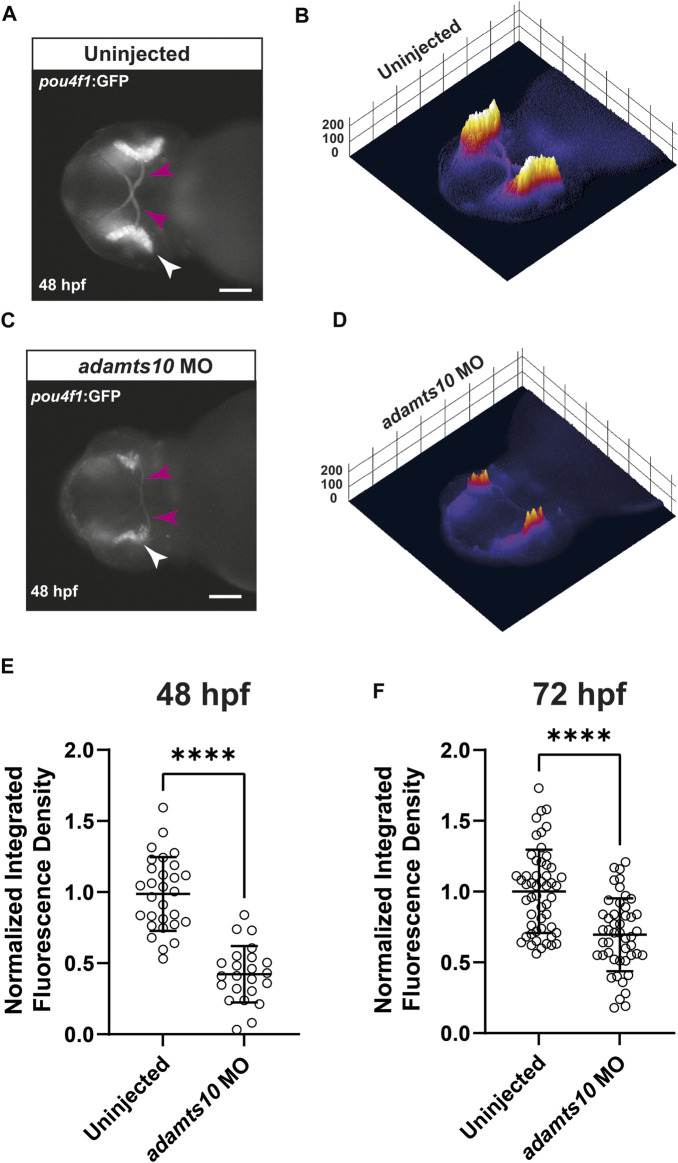
Adamts10 MO reduces pou4f1 enhancer-driven GFP fluorescence in zebrafish retinae. Representative fluorescent images of an uninjected (A) and an adamts10 MO-injected (C)Tg(pou4f1-hsp70l:GFP) embryo at 48 hpf showing pou4f1 enhancer-driven GFP fluorescence in the retina (white arrows) and optic nerves (magenta arrows, scale = 100 µm), with corresponding 3D surface plots of fluorescence intensity (B,D). (E) Normalized integrated fluorescence density of uninjected and adamts10 MO-injected embryos at 48 hpf (n = 29 and 23, respectively, ****p < 0.0001, Welch’s t-test). (F) Normalized integrated fluorescence density of uninjected and adamts10 MO-injected embryos at 72 hpf (n = 52 and n = 47, respectively, ****p < 0.0001; Welch’s t-test).

Figure Data
Acknowledgments
This image is the copyrighted work of the attributed author or publisher, and ZFIN has permission only to display this image to its users. Additional permissions should be obtained from the applicable author or publisher of the image. Full text @ Front Mol Biosci