
- Title
-
High-throughput transcriptome sequencing reveals the key stages of cardiovascular development in zebrafish embryos
- Authors
- Zhou, C., Zhao, W., Zhang, S., Ma, J., Sultan, Y., Li, X.
- Source
- Full text @ BMC Genomics
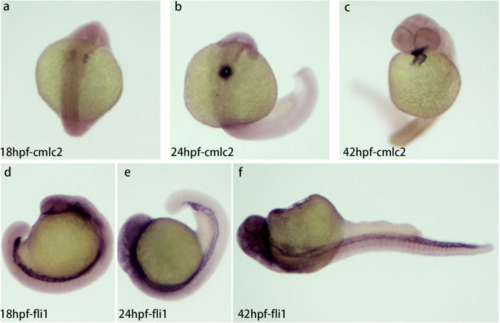
Expression of cardiomyocyte and endothelial marker genes (cmlc2, fli1) at three different stages of zebrafish embryo development (18, 24, 42 hpf). a-c Expression of cmlc2 at 18hpf (a), 24hpf (b), and 42hpf (c). A pair of primordia were generated at 18 hpf, one on each side of the midline (a), The primordia on both sides fused to form a single linear heart tube at 24 hpf (b), the heart tube undergoes a loop and the heart chamber was visible (c). V, ventricle; A, atrial. d-f Expression of fli1 at 18 hpf (d), 24 hpf (e). and 42hpf (f) |
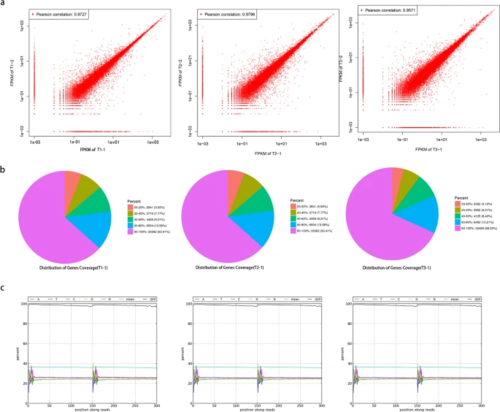
Quality analysis of transcriptome sequencing. a Correlation coefficient maps between different sequencing repeats. b Statistical maps of gene coverage. c Base composition and quality distributions |
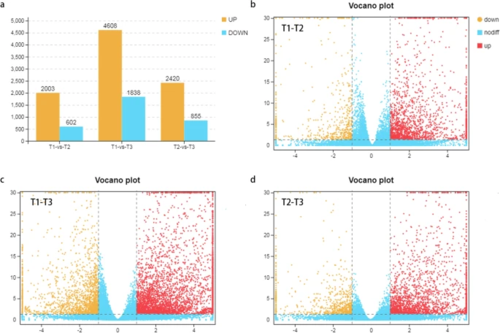
Analysis of DEGs in three stages of zebrafish embryo development. a Comparison of the number of up- and down-regulated genes. b-d Volcano plots between different groups. Yellow and red points represent up- and down-regulated genes, respectively, blue points represent genes with no differences |
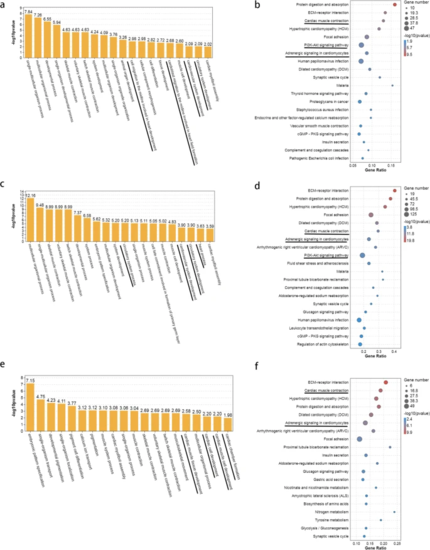
GO and KEGG enrichment analysis of DEGs between different stages of zebrafish embyro development. a GO enrichment analysis of DEGs between T1 and T2. b KEGG enrichment analysis of DEGs between T1 and T2. c GO enrichment analysis of DEGs between T1 and T3. d KEGG enrichment analysis of DEGs between T1 and T3. e GO enrichment analysis of DEGs between T2 and T3. f KEGG enrichment analysis of DEGs between T2 and T3 |
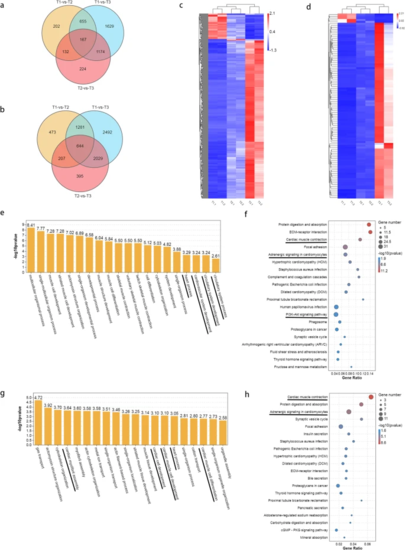
Common DEGs in three stages of zebrafish embryo development. a Common HDEGs were obtained in three stages. b Common DEGs were obtained in three stages. c Hierarchical clustering of 644 common DEGs. d Hierarchical clustering of 167 common HDEGs. e GO enrichment analysis of 644 common DEGs. f KEGG enrichment analysis of 644 common DEGs. g GO enrichment analysis of 167 common HDEGs. h KEGG enrichment analysis of 167 HDEGs |
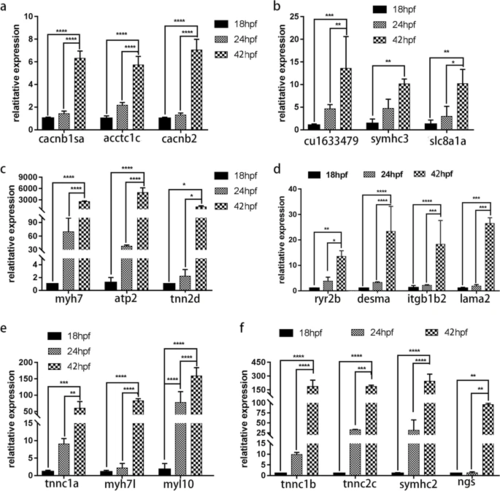
Validation of DEGs by qPCR. The expression of 18 hpf was set as 1, and the relative expression level of the other two stages (24 hpf and 42 hpf) was calculated for several genes. The asterisk indicates significantly different expression levels (*P < 0.05; **,*** and ****P < 0.01) |
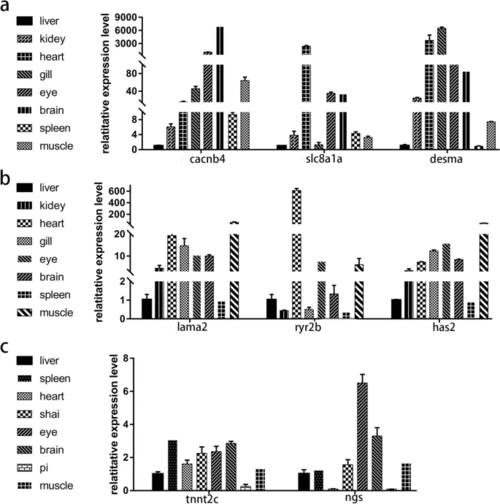
Expression of DEGs in different adult tissues |