
Image
|
Figure Caption
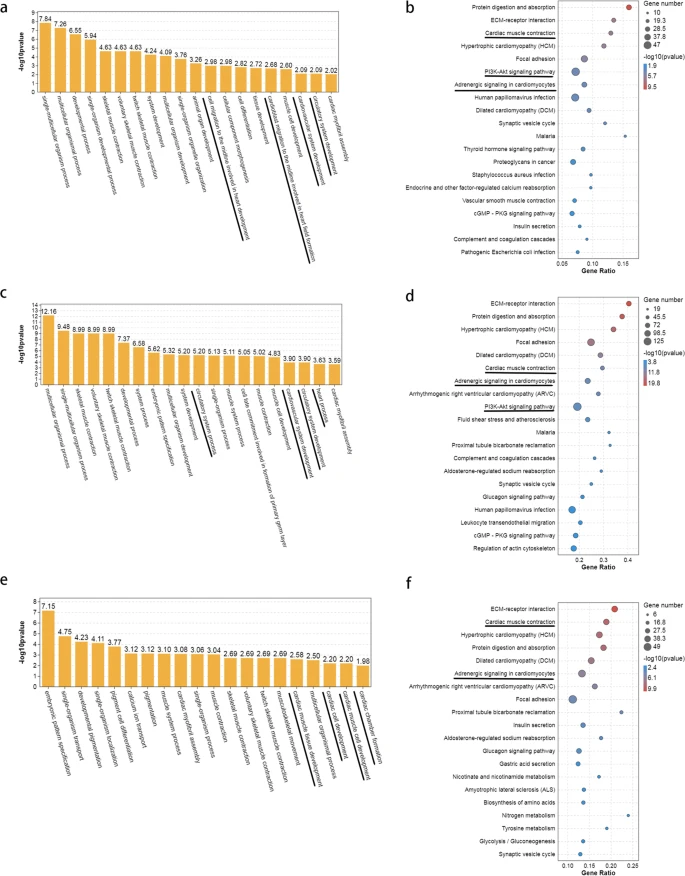
Fig. 4
GO and KEGG enrichment analysis of DEGs between different stages of zebrafish embyro development. a GO enrichment analysis of DEGs between T1 and T2. b KEGG enrichment analysis of DEGs between T1 and T2. c GO enrichment analysis of DEGs between T1 and T3. d KEGG enrichment analysis of DEGs between T1 and T3. e GO enrichment analysis of DEGs between T2 and T3. f KEGG enrichment analysis of DEGs between T2 and T3
Acknowledgments
This image is the copyrighted work of the attributed author or publisher, and
ZFIN has permission only to display this image to its users.
Additional permissions should be obtained from the applicable author or publisher of the image.
Full text @ BMC Genomics