
FIGURE
Fig. 2
- ID
- ZDB-FIG-220815-6
- Publication
- Zhou et al., 2022 - High-throughput transcriptome sequencing reveals the key stages of cardiovascular development in zebrafish embryos
- Other Figures
- All Figure Page
- Back to All Figure Page
Fig. 2
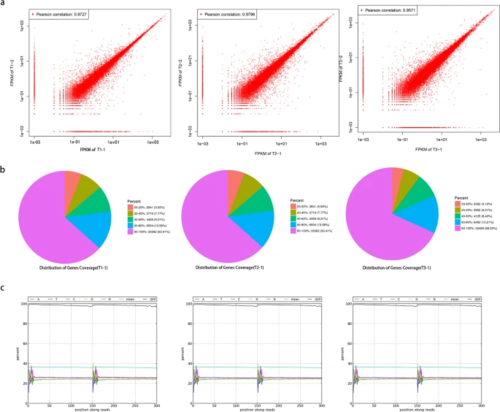
Quality analysis of transcriptome sequencing. a Correlation coefficient maps between different sequencing repeats. b Statistical maps of gene coverage. c Base composition and quality distributions |
Expression Data
Expression Detail
Antibody Labeling
Phenotype Data
Phenotype Detail
Acknowledgments
This image is the copyrighted work of the attributed author or publisher, and
ZFIN has permission only to display this image to its users.
Additional permissions should be obtained from the applicable author or publisher of the image.
Full text @ BMC Genomics