
Image
|
Figure Caption
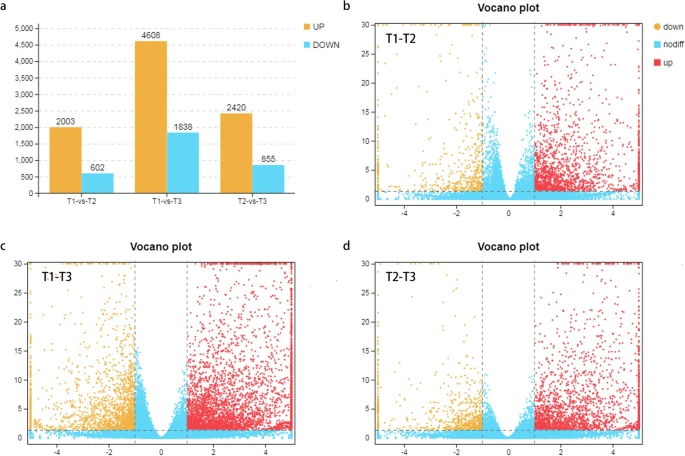
Fig. 3 Analysis of DEGs in three stages of zebrafish embryo development. a Comparison of the number of up- and down-regulated genes. b-d Volcano plots between different groups. Yellow and red points represent up- and down-regulated genes, respectively, blue points represent genes with no differences
Acknowledgments
This image is the copyrighted work of the attributed author or publisher, and
ZFIN has permission only to display this image to its users.
Additional permissions should be obtained from the applicable author or publisher of the image.
Full text @ BMC Genomics