
Image
|
Figure Caption
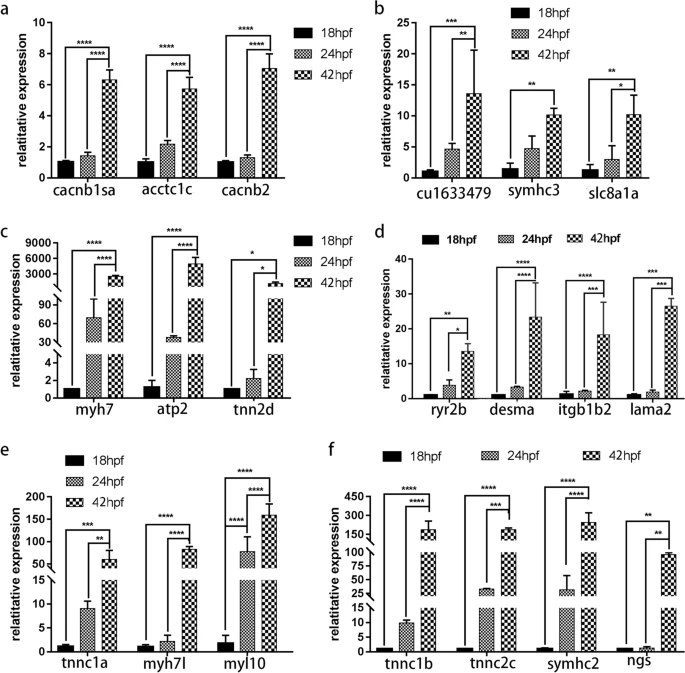
Fig. 6
Validation of DEGs by qPCR. The expression of 18 hpf was set as 1, and the relative expression level of the other two stages (24 hpf and 42 hpf) was calculated for several genes. The asterisk indicates significantly different expression levels (*P < 0.05; **,*** and ****P < 0.01)
Acknowledgments
This image is the copyrighted work of the attributed author or publisher, and
ZFIN has permission only to display this image to its users.
Additional permissions should be obtained from the applicable author or publisher of the image.
Full text @ BMC Genomics