FIGURE SUMMARY
Title

Irf2bp2a regulates terminal granulopoiesis through proteasomal degradation of Gfi1aa in zebrafish

Authors
Gao, S., Wang, Z., Wang, L., Wang, H., Yuan, H., Liu, X., Chen, S., Chen, Z., de Thé, H., Zhang, W., Zhang, Y., Zhu, J., Zhou, J.
Source
Full text @ PLoS Genet.

The establishment of a zebrafish <italic toggle='yes'>irf2bp2a</italic> knockout line.

(A) Schematic representation of Cas9 target site in the first exon of zebrafish irf2bp2a. The deleted nucleotides in the mutant gene are marked by hyphens. (B) Schematic representation of wild type (493 amino acids) and mutant Irf2bp2a proteins (122 amino acids). The site where the frameshift was introduced is marked by triangles. (C) Western blot analysis of FLAG-tagged wild type and mutant Irf2bp2a proteins expressed in HEK293 cells. (D) Immunofluorescence analysis of FLAG-tagged wild type (top panel) and mutant Irf2bp2a (bottom panel) proteins, demonstrating that the truncated protein lost its nuclear localization. Scale bar, 10 μm.

Deficiency of <italic toggle='yes'>irf2bp2a</italic> specifically impairs neutrophils maturation in embryonic and adult zebrafish.

(A-G’) WISH analyses of neutrophils markers mpx (A, A’, C-D’), c/ebp1 (B, B’), lyz (E-G’) from 22 hpf to 5 dpf in wild type (WT) and irf2bp2a-deficient embryos. Grey boxes and red arrows indicate the main position of positive cells for each marker. n/n, number of embryos showing representative phenotype/total number of embryos examined. (H, H’) GFP positive cells are decreased in irf2bp2a-/-//Tg(mpx:eGFP) embryos at 2 dpf. (I, I’) Sudan Black positive cells are reduced in irf2bp2a-deficient embryos at 3 dpf. (J) Statistical results for A-G’ (Student t test, N = 5, 16–30 embryos were used for each probe. Each dot represents the mean value of one experiment, which was obtained from the counts of all of the embryos in the same group. Error bars represent mean ± SEM. ***P < 0.001, ****P <0.0001, *****P < 0.00001). (K) Statistical results for H-I’ (Student t test, N = 6, 16–22 embryos were used for each experiment. Each dot represents the mean value of one experiment. Error bars represent mean ± SEM. ****P < 0.0001, *****P <0.00001). (L) Quantitative reverse transcriptase polymerase chain reaction analysis of neutrophils differentiation-related genes in GFP positive cells enriched from Tg(mpx:eGFP) and irf2bp2a-/-//Tg(mpx:eGFP) embryos at 2 dpf. To determine the relative expression rate, data were normalized to the expression level of WT groups (which were set to 1.0) after normalized to the internal control of β-actin (Student t test, N = 5. Error bars represent mean ± SEM. ***P < 0.001, ****P < 0.0001). (M) FACS analysis of GFP positive cells within the R5 gate of WKMs in four-month-old wild type Tg(mpx:eGFP) (left panel) and irf2bp2a-/-//Tg(mpx:eGFP) zebrafish (right panel). (N) Statistical results for M in wild type Tg(mpx:eGFP) and irf2bp2a-/-//Tg(mpx:eGFP) zebrafish. (Student t test, N = 5, each time 1 male and 1 female were used in the WT group and 2 males and 2 females were used in the mutant group. Error bars represent mean ± SEM. **P < 0.01). (O) May-Grünwald Giemsa staining of mpx+ neutrophilss isolated from R5 gate of irf2bp2a-/-//Tg(mpx:eGFP) mutants and siblings. Scale bar, 10 μm. (P) 500 cytospin-collected GFP+ cells were counted on slides. Immature and mature neutrophils were distinguished and quantitated by morphology, and the proportion of mature neutrophils was compared between WT and mutant groups (Student t test, N = 3. Error bars represent mean ± SEM. **P < 0.01).

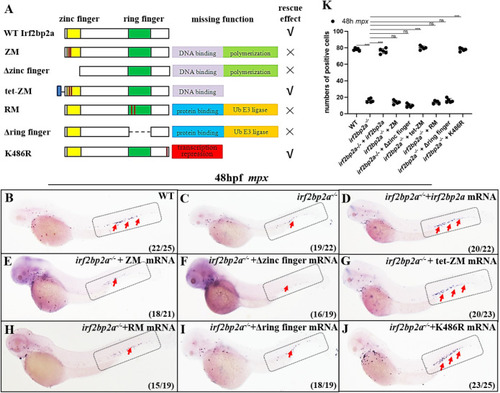
Polymerization and potential ubiquitin E3 ligase function are indispensable for Irf2bp2a in regulating the differentiation of neutrophilss.

(A) Structure, missing function and rescue effect of wild type and variant forms of Irf2bp2a. (B-J) Irf2bp2a mRNA rescue assays in irf2bp2a-/- embryos. Mpx probe was used in WISH to examine rescue effect with wild irf2bp2a (D), ZM (E), Δzinc finger (F), tet-ZM (G), RM (H), Δring finger (I) and K486R mutant (J) mRNA injections. (K) The statistical significance was calculated by using one-way ANOVA. The statistical significance was calculated using 1-way ANOVA followed by Dunnett T3 correction. The asterisk indicates a statistical difference (N = 5, 15–25 embryos were used for each experiment. Each dot represents the mean value of one experiment. Error bars represent mean ± SEM. ns: no statistical significance; ***P < 0.001).

Irf2bp2a targets the transcription repressor Gfi1aa for ubiquitination and proteasomal degradation.

(A) Luciferase reporter assay. Bars showed the relative luciferase activity on the zebrafish c/ebpα promoter (-2.0 kb), c/ebp1 promoter (-2.1 kb), and pu.1 promoter (-1.7 kb) (Student t test, N = 3. Error bars represent mean ± SEM. **P < 0.01, ***P < 0.001). (B) Western blot analysis (anti-FLAG and anti-HA) of FLAG-Irf2bp2a, FLAG-Irf2bp2a RM, and HA-Gfi1aa expressed in HEK293 cells. The proteasome inhibitor MG132 (2.5 μM) was used to inhibit the degradation of ubiquitinated proteins. Equal protein amounts for each sample were loaded (anti-Actin). (C) HA-Gfi1aa protein was immunoprecipitated (IP) with an anti-HA antibody from HEK293 cells co-expressing Ubiquitin and FLAG-Irf2bp2a. Many more adducts of Ubiquitin were detected by western blot with an anti-Ubiquitin antibody. (D) WISH assay of mpx in WT, irf2bp2a-/- mutant embryos, wild type and irf2bp2a-/- mutant embryos injected with gfi1aa MO, gfi1aa-/- embryos, and gfi1aa-/- embryos injected with irf2bp2a MO. (E) Statistic result for D. The statistical significance was calculated by using one-way ANOVA. The asterisk indicates a statistical difference (N = 5, 19–30 embryos were used for each experiment. Each dot represents the mean value of one experiment. Error bars represent mean ± SEM. **P < 0.01; ***P < 0.001).

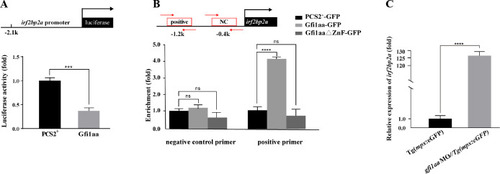
<italic toggle='yes'>Irf2bp2a</italic> gene is repressed by Gfi1aa.

(A) Luciferase reporter assay. Bars showed the relative luciferase activity on the zebrafish irf2bp2a promoter (-2.1 kb) (Student t test, N = 3. Error bars represent mean ± SEM. ***P < 0.001). (B) CHIP-PCR analysis of irf2bp2a promoter in zebrafish embryos expressing GFP, Gfi1aa-GFP or Gfi1aa-Δzinc finger-GFP using an anti-GFP antibody. The statistical significance was calculated by using one-way ANOVA. The asterisk indicates a statistical difference (N = 4. Error bars represent mean ± SEM. ns: not statistically significant, ****P < 0.0001). (C) irf2bp2a relative expression level analyzed by quantitative PCR in GFP-positive cells sorted from control Tg(mpx:eGFP) embryos and gfi1aa MO injected Tg(mpx:eGFP) morphants at 2 dpf (Student t test, N = 5. Error bars represent mean ± SEM. ****P < 0.0001).

EXPRESSION / LABELING:
Gene:
Fish:
Knockdown Reagent:
Anatomical Term:
Stage: Long-pec
Acknowledgments
This image is the copyrighted work of the attributed author or publisher, and ZFIN has permission only to display this image to its users. Additional permissions should be obtained from the applicable author or publisher of the image. Full text @ PLoS Genet.