- Title
-
Studies in Zebrafish Demonstrate That CNNM2 and NT5C2 Are Most Likely the Causal Genes at the Blood Pressure-Associated Locus on Human Chromosome 10q24.32
- Authors
- Vishnolia, K.K., Hoene, C., Tarhbalouti, K., Revenstorff, J., Aherrahrou, Z., Erdmann, J.
- Source
- Full text @ Front Cardiovasc Med
|
|
|
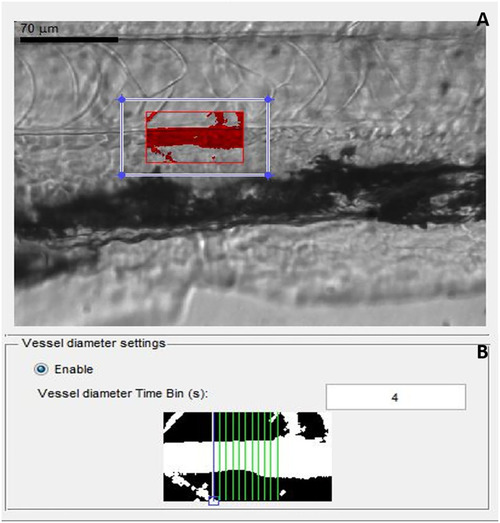
Screen shot images of MicroZebraLab software while recording a video file for analyzing blood flow parameters from zebrafish. |
|
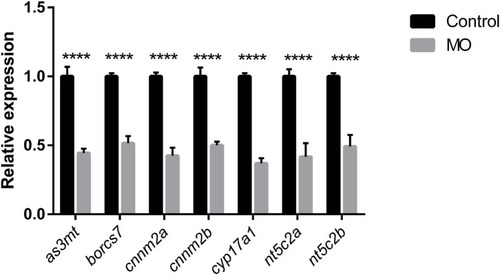
Graph represents downregulation of the relative gene expression of EXPRESSION / LABELING:
PHENOTYPE:
|
|
Graphs represents blood flow parameters measured after downregulation of PHENOTYPE:
|
|
Blood flow parameters measured from heterozygote and homozygote PHENOTYPE:
|
|
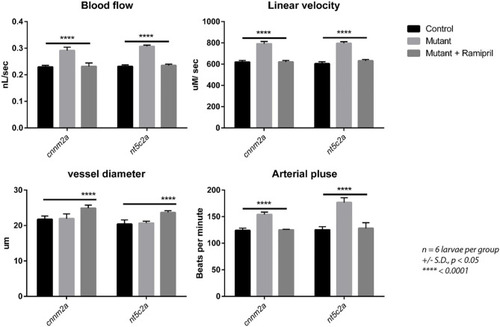
Blood flow parameters measured with and without Ramipril treatments from PHENOTYPE:
|
|
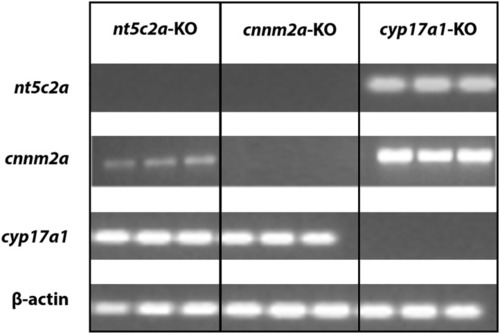
Co-regulation of cnnm2 and nt5c2 genes. Agarose gel micrograph representing bands of DNA samples collected from cnnm2a, cyp17a1, and nt5c2a mutants. Each set of samples were investigated for expression of other genes along with house-keeping genes. EXPRESSION / LABELING:
PHENOTYPE:
|
|
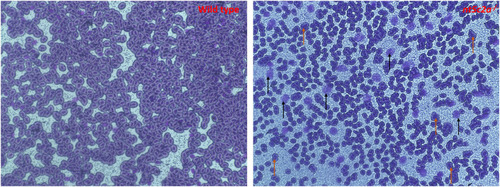
Microscopic images of May-Grünwald-Giemsa–stained blood smear from ab-wildtype and PHENOTYPE:
|
|
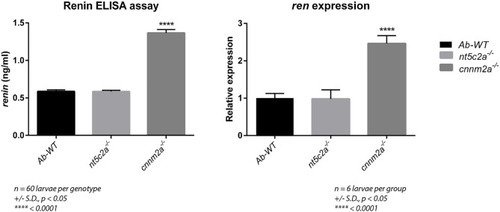
Graph on the left presents the renin levels (ng/ml) measured using ELISA assay from ab-wildtypes, |
|
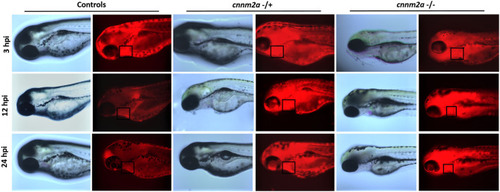
Zebrafish cnnm2a mutant (heterozygote and homozygote) larvae along with wildtype controls micro injected with rhodamine dextran dye in their pericardial sac. Bright field and fluorescent images captured at 3, 12, and 24 h post injection represent the inefficiency of cnnm2a mutant larvae to filter the dextran dye through kidney as the controls. Images were captured using Keyence inverted microscope at 40X magnification. PHENOTYPE:
|

ZFIN is incorporating published figure images and captions as part of an ongoing project. Figures from some publications have not yet been curated, or are not available for display because of copyright restrictions. EXPRESSION / LABELING:
PHENOTYPE:
|

