
Image
|
Figure Caption
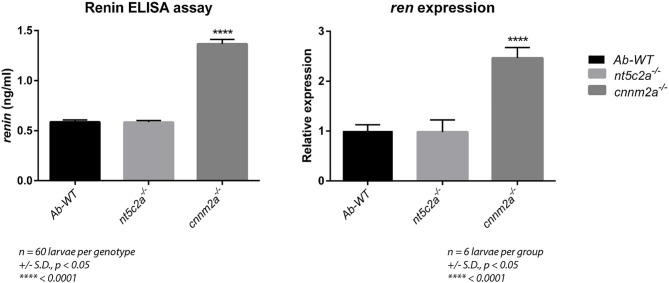
Figure 9
Graph on the left presents the renin levels (ng/ml) measured using ELISA assay from ab-wildtypes,
Figure Data
Acknowledgments
This image is the copyrighted work of the attributed author or publisher, and
ZFIN has permission only to display this image to its users.
Additional permissions should be obtained from the applicable author or publisher of the image.
Full text @ Front Cardiovasc Med