- Title
-
The V-ATPase accessory protein Atp6ap1b mediates dorsal forerunner cell proliferation and left-right asymmetry in zebrafish
- Authors
- Gokey, J.J., Dasgupta, A., Amack, J.D.
- Source
- Full text @ Dev. Biol.
|
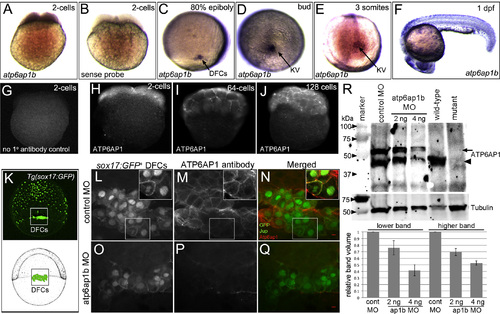
Atp6ap1b is maternally supplied and prominently expressed in dorsal forerunner cells and Kupffer’s vesicle. (A–F) RNA in situ hybridizations of atp6ap1b during early zebrafish development. (A) Antisense atp6ap1b probes revealed maternal atp6ap1b mRNA in the 2-cell embryo. (B) A control atp6ap1b sense probe showed no staining. (C–E) atp6ap1b mRNA was detected in DFCs and KV cells during epiboly and early somite stages. (F) atp6ap1b was observed in mucus secreting cells, eye and brain at 24 hpf. (G–J) Fluorescent immunostaining with ATP6AP1 antibodies detected maternal protein at the 2-cell (H), 64-cell (I) and 128-cell (J) stages. There was no signal in control experiments that lacked ATP6AP1 antibody (G). (K) Schematic diagram and whole-embryo view of a Tg(sox17:GFP) embryo that expresses GFP in DFCs and endoderm at 80% epiboly. The box indicates the approximate region of interest shown in L–Q. (L–Q) ATP6AP1 antibodies labeled all cells during epiboly stages, including GFP+ DFCs, in control MO injected Tg(sox17:GFP) embryos (L–N). Jup antibodies were used to mark plasma membranes in DFCs. Insets show ATP6AP1 staining was observed in the cytoplasm and plasma membranes. ATP6AP1 staining was reduced in Atp6ap1b MO embryos (O–Q). (R) Western blot analysis of Atp6ap1 expression. ATP6AP1 antibodies detected prominent bands just under 50 kDa (arrowhead) and just higher that 50 kDa (arrow) in control embryos at the bud stage (10 hpf) that were reduced in a dose-dependent fashion in atp6ap1b MO embryos. The lower band was detected in wild-type embryos at 7 dpf, and was reduced in atp6ap1ba82/a82 mutants. Tubulin was used as a loading control. The graph shows average relative intensities of both Atp6ap1 bands from three MO experiments. EXPRESSION / LABELING:
PHENOTYPE:
|
|
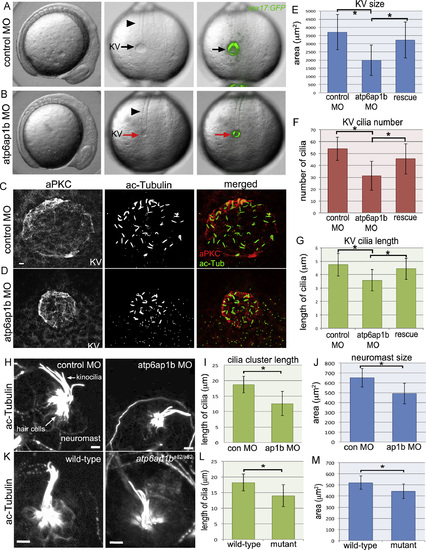
Atp6ap1b depletion altered KV organ size and cilia formation. (A, B) Analysis of live Tg(sox17:GFP) embryos injected with control (A) or atp6ap1b MO (B) at the 8 somite stage. atp6ap1b MO embryos were indistinguishable from controls except for the small size of KV (arrows) labeled by GFP expression. The notochord (arrowheads) appeared normal in atp6ap1b MO embryos. (C, D) Immunofluorescent staining of KVs using aPKC antibodies to label apical membranes and acetylated tubulin (ac-Tub) antibodies to label cilia in control (C) or atp6ap1b (D) MO embryos. (E–G) Quantification of KV area (E), KV cilia number (F), and KV cilia length (G) in control MO (n=32) embryos, atp6ap1b MO injected (n=53) embryos and rescue (n=34) embryos co-injected with atp6ap1b MO+atp6ap1b mRNA. (H-M) Analysis of neuromasts stained with ac-Tub antibodies at 3 dpf in control MO and atp6ap1b MO embryos (H) or wild-type and atp6ap1ba82/a82 mutants (K). Kinocilia cluster length and neuromast area were reduced in atp6ap1b MO injected (n=13) embryos relative to controls (n=13) (I–J) and in atp6ap1ba82/a82 mutants (n=7) relative to wild-type (n=7) siblings (L–M). All scale bars=5 µm. EXPRESSION / LABELING:
PHENOTYPE:
|
|
Depletion of maternal and zygotic Atp6ap1b disrupted LR patterning. (A–C) RNA in situ hybridizations of the cardiac-specific cmlc2 marker were used to assess heart looping (arrow) at 2 dpf. v=ventricle; a=atrium. Normal rightward looping (A) was observed in wild-type embryos, whereas heart looping often failed (B) or was reversed (C) in embryos injected with two different translation-blocking MOs. (D) Quantification of heart looping phenotypes in atp6ap1b MO embryos. MO-induced heart looping defects were partially rescued by co-injection with atp6ap1b mRNA. (E–H) RNA in situ hybridization analysis of spaw expression (arrow) at 18 somite stage that is left-sided in controls (E), but reversed (F), bilateral (G) or absent (H) in many atp6ap1b MO embryos (I). EXPRESSION / LABELING:
PHENOTYPE:
|
|
Inhibiting V-ATPase function disrupted cardiac left–right asymmetry, KV organ size and KV cilia formation. (A) Concanamycin A treatments between the 50% epiboly stage and the 6 somite stage or MO depletion of Atp6v1f altered heart looping as compared to controls. Heart defects in atp6v1f MO embryos were significantly rescued by atp6v1f mRNA. (B–D) Immunofluorescent staining of KV using aPKC and acetylated-Tubulin markers. (E–G) Quantification of KV cilia length (E), cilia number (F), and KV size (G) in DMSO control (n=17) embryos, concanamycin A treated (n=26) embryos and atp6v1f MO injected (n=22) embryos. Scale bars=5 µm. EXPRESSION / LABELING:
PHENOTYPE:
|
|
Atp6ap1b depletion reduced cytoplasmic pH of DFCs. (A–F) Analysis of cytoplasmic pH in living embryos during epiboly stages using SNARF-5F fluorescent indicator. DFCs (A,D) are labeled with GFP in Tg(sox17:GFP) embryos and are outlined with a dotted line. (B,E) pH-dependent SNARF-5F fluorescence at 640 nm. (C,F) Pseudocolored ratiometric (640 nm/580 nm) image of SNARF-5F signals. Blue indicates high pH and red indicates low pH. (G–L) LysoTracker vital dye labeling of acidic compartments (e.g. lysosomes) in live embryos. (G,J) GFP+ DFCs are outlined with a dotted line. (H,K) LysoTracker fluorescent staining labels acidic organelles. (I,L) Merged overlay of LysotTracker (red) and DFCs (green). (M) Quantification of SNARF-5F ratio in DFCs and adjacent dorsal margin cells in control MO and atp6ap1 MO injected embryos. (N) Quantification of LysoTracker fluorescence in control and atp6ap1 MO embryos. ns=not significant. AU= arbitrary units. EXPRESSION / LABELING:
PHENOTYPE:
|
|
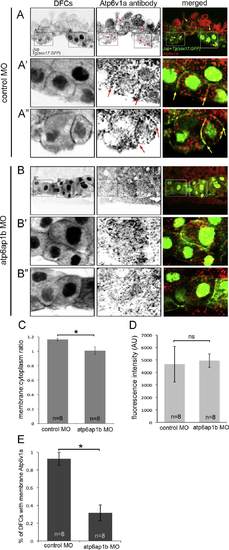
Atp6v1a localization in DFCs is altered in Atp6ap1b depleted embryos. (A,B) Confocal sections through a subset of DFCs labeled with Atp6v1a antibodies. Punctate Atp6v1a signals were detected in the cytoplasm and along some plasma membranes (arrows) marked by Jup antibodies in DFCs in Tg(sox17:GFP) embryos injected with control MO (A). A′ and A′′ show enlarged images of the boxed regions in A. Plasma membrane association of Atpv1a signals was reduced in Atp6ap1b MO embryos (B). B′ and B′′ show enlarged images of the boxed regions in B. (C) A plasma membrane-to-cytoplasm ratio of Atp6v1a fluorescence in DFCs. (D) Overall Atpv1a fluorescence in DFCs. (E) The percentage of DFCs found to have Atp6v1a puncta associated with Jup staining at the plasma membrane. EXPRESSION / LABELING:
PHENOTYPE:
|
|
Atp6ap1b regulates proliferation of DFCs. (A–C) Quantification of DFC/KV cell numbers in Tg(sox17:GFP) embryos between 60% epiboly and 8 somite stages revealed a reduction of cells in atp6ap1b MO injected embryos relative to controls. (D–I) Phosphorylated Histone H3 (pHH3) antibodies labeled proliferating cells in Tg(sox17:GFP) embryos injected with control MO (D–F) or atp6ap1b MO (G–I). Merged images (F,I) of DFCs (green) and pHH3 (red) show examples of proliferating DFCs (arrows) at the 60% epiboly stage. (J) Percentage of embryos with proliferating DFCs at the indicated stages. (K) The percentage of DFCs proliferating in control MO and Atp6ap1 MO injected embryos. (L–M) Embryos injected with atp6v1f MO or treated with concanamycin A between the 50% and 75% epiboly stages were analyzed at the 80% epiboly stage. Treated embryos had a reduced number of DFCs (L) and reduced DFC proliferation (M) as compared to controls. (N) In contrast to DFCs, there was no difference in pHH3 labeling of neighboring dorsal margin cells between atp6ap1b MO and control embryos. EXPRESSION / LABELING:
PHENOTYPE:
|
|
Expression of the zebrafish V-ATPase accessory protein Atp6ap1b. (A) RT-PCR of temporal expression of atp6ap1b and atp6ap1a through the first three days of development. β-actin was used as a loading control. (B) Schematic diagram and alignment of human, mouse and zebrafish Atp6ap1 proteins. (C) RT-PCR detected maternal mRNA (at the 1-cell stage) of several V-ATPase subunits and then sustained expression through 2dpf. β-actin mRNA was used as a loading control. (D) Homozygous atp6ap1ba82/a82 mutants developed pigmentation phenotypes relative to wild-type siblings. (E) Western blot analysis of Atp6ap1 in wild-type and atp6ap1ba82/a82 mutant embryos at 3, 5 and 7 dpf. A prominent band just under 50 kDa was reduced in mutants. Tubulin was used as a loading control. The graph depicts relative intensities of the Atp6ap1 band from one representative experiment. (F) Fluorescent immunostaining of Atp6ap1 in surface cells of wild-type and atp6ap1ba82/a82 mutant embryos at 3, 5 and 7 dpf. The graph shows the average fluorescent intensity of Atp6ap1 staining. |
|
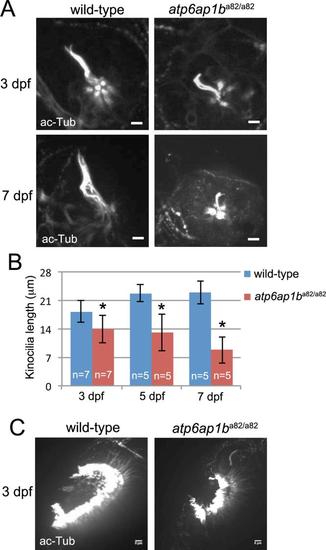
Developmental defects in ciliated organs ofatp6ap1ba82/a82mutants. (A) Neuromast kinocilia were labeled with acetylated-Tubulin antibodies in wild-type and atp6ap1ba82/a82 mutants at 3 and 7 dpf. (B) Measurement of kinocilia length revealed shortened kinocilia in atp6ap1ba82/a82 mutants at 3, 5 and 7 dpf. (C) Visualization of cilia in olfacotory placodes using acetylated-Tubulin antibodies at 3 dpf. Olfactory placodes were smaller in atp6ap1ba82/a82 mutants (n=7) as compared to wild-type siblings (n=7). EXPRESSION / LABELING:
PHENOTYPE:
|

ZFIN is incorporating published figure images and captions as part of an ongoing project. Figures from some publications have not yet been curated, or are not available for display because of copyright restrictions. EXPRESSION / LABELING:
PHENOTYPE:
|
|
Concanamycin A treatments are effective in DFCs within 30 min. (A-B) The vital dye LysoTracker, which labels acidic organelles, was used to monitor efficacy of whole-embryo concanamycin A treatments. DFCs were labeled with GFP by sox17:GFP transgene expression. After 30 min, fluorescent LysoTracker signal was greatly reduced in live embryos treated with concanamycin (B) as compared to control embryos treated with DMSO (A). |
|
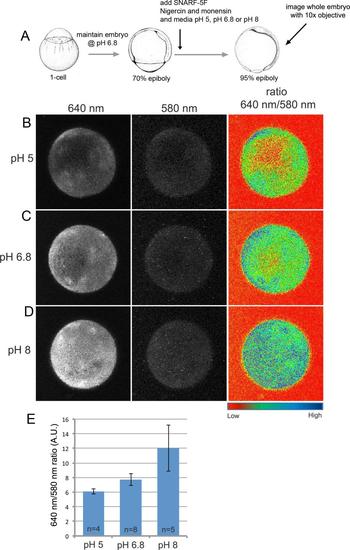
SNARF-5F displays pH-dependent fluorescence in the zebrafish embryo. (A) Cartoon of experimental design to validate SNARF-5F utility in zebrafish. (B-D) Fluorescent images of entire wild-type embryos treated with nigercin and monensin and then maintained at pH 5 (B), pH 6.8 (C) or pH 8 (D). Fluorescence emission at 640 nm increased with pH, whereas emission at 580 nm was pH-independent and served as a dye loading control. A heat map of the 640 nm to 580 nm ratio revealed pH-dependent intensity differences. (E) Average 640 nm to 580 nm ratios show a consistent pH-dependent increase of SNARF-5F fluorescence. A. U.=arbitrary units. |
|
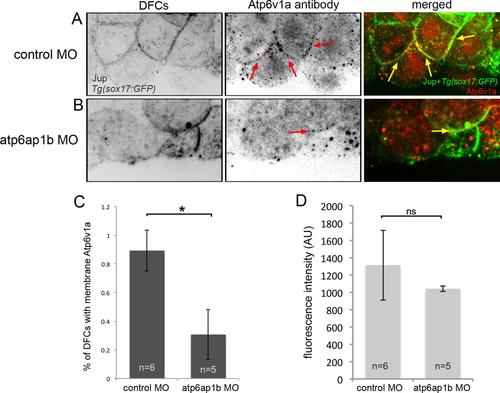
Atp6v1a localization in DFCs is altered in Atp6ap1b depleted embryos. (A-B) Confocal sections through a subset of DFCs labeled with an Atp6v1a antibody from Genescript. Punctate Atp6v1a signals were detected in the cytoplasm and along some plasma membranes (arrows) marked by Jup antibodies in DFCs in Tg(sox17:GFP) embryos injected with control MO (A). Plasma membrane association of Atpv1a signals was still detected (arrow), but was reduced in Atp6ap1b MO embryos (B). (C) The percentage of DFCs found to have Atp6v1a puncta associated with Jup staining at the plasma membrane. (D) Overall Atpv1a fluorescence in DFCs. |
|
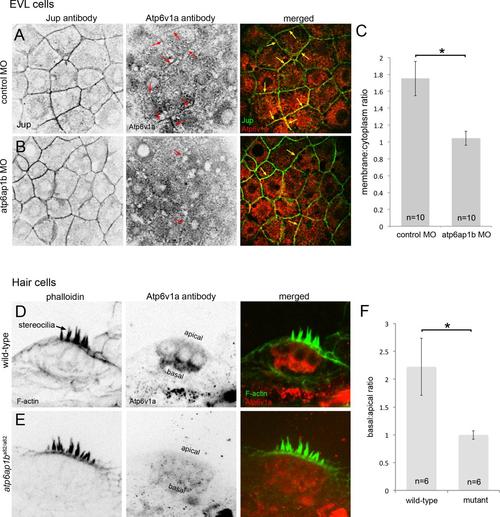
Loss of Atp6ap1b alters subcellular localization of Atp6v1a. (A) In enveloping layer (EVL) cells, Atp6v1a puncta were found in the cytoplasm and some plasma membranes (arrows) in control embryos during epiboly. (B) Plasma membrane localization was reduced in Atp6ap1b depleted embryos. (C) A plasma membrane-to-cytoplasm ratio of Atp6v1a in EVL. (D) Atp6v1a staining in 3 dpf neuromasts localized basally in wild-type hair cells counter stained with phalloidin to detect actin-rich stereocilia. (E) Basal Atp6v1a localization was disrupted atp6ap1ba82/a82 mutants. (F) Basal-to-apical ratio of of Atp6v1a fluorescence in hair cells. |
|
Cell migration dynamics are not altered in Atp6ap1b MO embryos. (A) Time-lapse tracking of DFCs in control and Atp6ap1b MO embryos (see movies 1 and 2). Five representative DFCs were tracked for 30 min during epiboly to quantify migration behaviors. (B-C) Average velocity and distance traveled for DFCs in control MO embryos (n=15 DFCs from 3 embryos) and atp6ap1b MO embryos (n=15 DFCs from 3 embryos). |
|
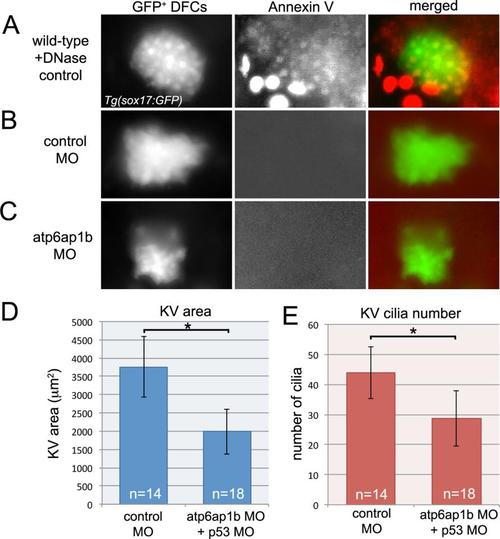
Atp6ap1b MO does not increase apoptosis. (A) Uninjected control embryos were treated with DNAse I to induce apoptosis and then used as positive control for annexin V labeling of apoptotic cells in Tg(sox17:GFP) embryos. (B,C) Annexin V labeling did not detect apoptotic DFCs in control MO (B) or atp6ap1b MO (C) injected embryos. (d-E) p53 MO was co-injected with control MO or atp6ap1b MO to determine if blocking apoptosis would rescue atp6ap1b MO phenotypes. Embryos co-injected with atp6ap1 MO-1+p53 MO showed defects in KV size (D) and cilia number (E) that were similar to those observed in embryos injected with atp6ap1 MO-1 alone (see Fig. 2). |
Reprinted from Developmental Biology, 407(1), Gokey, J.J., Dasgupta, A., Amack, J.D., The V-ATPase accessory protein Atp6ap1b mediates dorsal forerunner cell proliferation and left-right asymmetry in zebrafish, 115-30, Copyright (2015) with permission from Elsevier. Full text @ Dev. Biol.

