- Title
-
Bmps and id2a act upstream of twist1 to restrict ectomesenchyme potential of the cranial neural crest
- Authors
- Das, A., and Crump, J.G.
- Source
- Full text @ PLoS Genet.
|
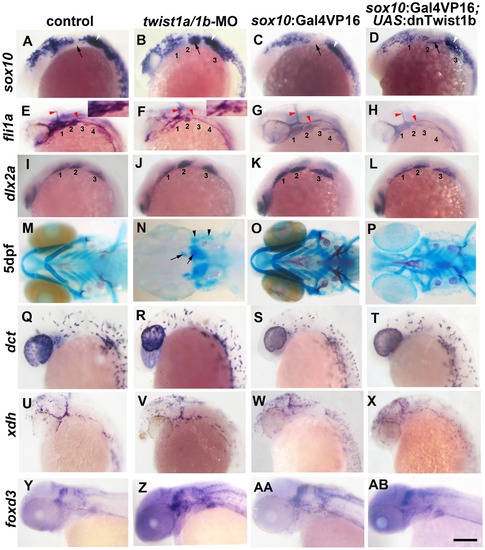
Twist1 genes are required for ectomesenchyme specification in zebrafish. (A–D) Whole mount in situ hybridizations of sox10 expression at 18 hpf show ectopic expression in the arches (numbered and second arch indicated by black arrow) of twist1a/1b-MO (n = 16/16) and sox10:Gal4VP16; UAS:dnTwist1b (n = 4/4) embryos compared to un-injected (n = 0/14) and sox10:Gal4VP16 only (n = 0/9) controls. White arrowheads indicate otic expression. (E–H) Whole mount in situs at 24 hpf show reduction of fli1a expression in the arch ectomesenchyme (numbered) of twist1a/1b-MO (n = 12/12) and sox10:Gal4VP16; UAS:dnTwist1b (n = 5/5) embryos compared to un-injected (n = 0/13) and sox10:Gal4VP16 only (n = 0/8) controls. Insets in E and F highlight arch ectomesenchyme which is reduced in twist1a/1b-MO embryos. Vascular expression of fli1a (red arrowheads) is unaffected. (I–L) Whole mount in situs at 18 hpf show a slight reduction of dlx2a in sox10:Gal4VP16; UAS:dnTwist1b embryos (n = 4/4) but not un-injected (n = 0/6), twist1a/1b-MO (n = 0/8), and sox10:Gal4VP16 only (n = 0/6) embryos. (M-P) Skeletal staining at 5 dpf shows severe loss of CNCC-derived head skeleton in twist1a/1b-MO embryos (n = 21/21) and primarily jaw reductions in sox10:Gal4VP16; UAS:dnTwist1b embryos (n = 9/9) compared to no defects in un-injected (n = 0/24) and sox10:Gal4VP16 only (n = 0/16) controls. Whereas only small remnants remain of the CNCC-derived skeleton (arrows), the mesoderm-derived otic capsule cartilage (arrowheads) and posterior neurocranium are less affected in twist1a/1b-MO embryos. (Q–T) In situs for dct expression at 28 hpf show normal melanophore precursors in un-injected (n = 14), twist1a/1b-MO (n = 12), sox10:Gal4VP16 only (n = 8), and sox10:Gal4VP16; UAS:dnTwist1b (n = 8) embryos. (U–X) In situs for xdh expression at 28 hpf show normal xanthophore precursors in un-injected (n = 7), twist1a/1b-MO (n = 5), sox10:Gal4VP16 only (n = 9), and sox10:Gal4VP16; UAS:dnTwist1b (n = 8) embryos. (Y-AB) In situs for foxd3 expression at 48 hpf reveal largely normal patterns of glia in un-injected (n = 9), twist1a/1b-MO (n = 8), sox10:Gal4VP16 only (n = 9), and sox10:Gal4VP16; UAS:dnTwist1b (n = 8) embryos. Scale bar = 50 μm. EXPRESSION / LABELING:
PHENOTYPE:
|
|
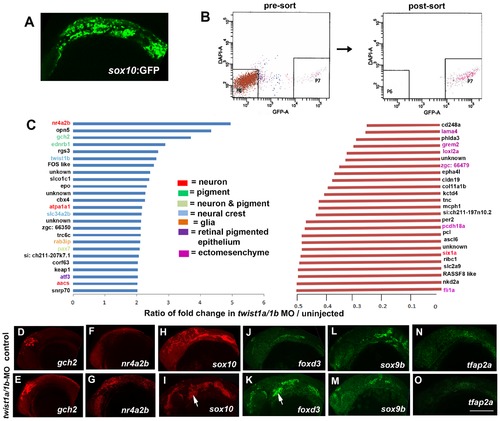
Gene expression profiling in twist1a/1b-MO embryos. (A,B) sox10:GFP-positive and -negative cells were isolated from un-injected or twist1a/1b-MO embryos at 18 hpf by FACS. (C) Fold changes of the GFP+/GFP ratios between twist1a/1b-MO and un-injected controls show the top 25 up-regulated (blue) and down-regulated (red) genes after Twist1 depletion. Color codes indicate where genes are expressed based on the published literature (see Table S1 for references). (D–O) Confocal projections of fluorescent in situ hybridizations show expanded expression of gch2 and nr4a2b at 18 hpf, ectopic arch expression (arrows) of sox10 and foxd3 at 24 hpf, but no change in sox9b and tfap2a expression at 24 hpf in twist1a/1b-MO versus un-injected controls. Scale bar = 50 μm. EXPRESSION / LABELING:
|
|
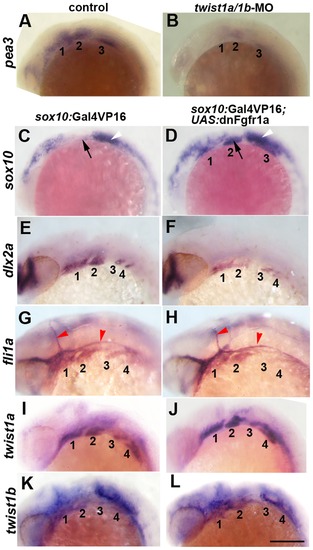
Fgf signaling depends on Twist1 and regulates a subset of ectomesenchyme gene expression. (A,B) In situs at 18 hpf show that expression of the Fgf target gene pea3 is reduced in the arches (numbered) of twist1a/1b-MO embryos (n = 8/8) compared to un-injected controls (n = 0/12). (C–L) sox10:Gal4VP16; UAS:dnFgfr1a embryos show ectopic arch expression of sox10 at 18 hpf (n = 8/8) versus controls (n = 0/8), reduction of dlx2a at 24 hpf (n = 3/3) versus controls (n = 0/3), but no change in fli1a at 24 hpf (n = 0/7) versus controls (n = 0/5). twist1a expression was unchanged at 24 hpf in dnFgfr1a embryos (n = 10) compared to controls (n = 7), as was twist1b expression in dnFgfr1a embryos (n = 8) compared to controls (n = 8). Black arrows indicate the second arch, white arrowheads the ear, and red arrowheads the vasculature. Scale bar = 50 μm. EXPRESSION / LABELING:
|
|
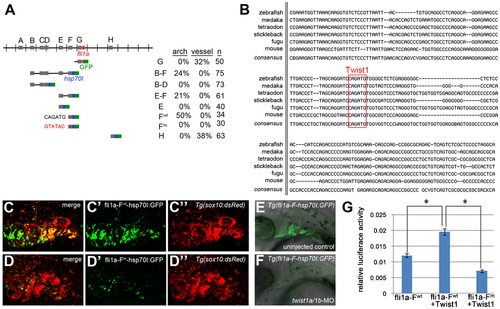
Twist1 regulates fli1a expression through an ectomesenchyme-specific enhancer. (A) Schematic shows the fli1a genomic locus with hatch marks at 1 kb intervals. Predicted enhancers (grey boxes, “A–H”) and the first exon (red box) are shown. Below are the various enhancer constructs analyzed, with the hsp70I core promoter in blue and GFP in green. Wild-type (black) and mutant (red) versions of the putative Twist1 binding site are also shown, as is the percentage of transient transgenic embryos showing GFP expression in the pharyngeal arches or vasculature. (B) Alignment of the central portion of the F enhancer between five fish species and mouse. The putative bHLH/Twist1 binding site is boxed in red. (C,D) Confocal projections of 32 hpf sox10:dsRed embryos injected at the one-cell-stage with fli1a-F enhancer constructs. The wild-type (C) but not mutant (D) enhancer drives arch expression. (E and F) Confocal sections of merged GFP and DIC channels show that a stable Tg(fli1a-F-hsp70I:GFP) line displays arch GFP expression in 32 hpf wild-type (E) but not twist1a/1b-MO (F) embryos. (G) Luciferase activity relative to renilla firefly activity in 293T cells transfected with wild-type or mutant fli1a-F enhancer reporter constructs, with or without a Twist1 expression plasmid. Asterisks indicate significant comparisons using a student′s t-test (p<0.05). Arbitrary units and standard error of the mean are shown. EXPRESSION / LABELING:
|
|
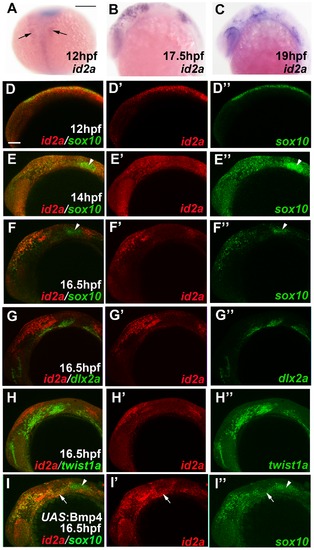
id2a is regulated by Bmps and excluded from the ectomesenchyme. (A–C) Colorimetric in situs show weak expression of id2a in pre-migratory CNCCs at 12 hpf (dorsal view with anterior up, arrows indicate bilateral CNCC fields) and increasing expression in non-ectomesenchyme precursors at 17.5 and 19 hpf (lateral views). (D–I) Confocal projections of fluorescent in situs show co-localization of id2a with sox10 in CNCCs at 12 hpf (D) and 14 hpf (E), as well as co-localization in the non-ectomesenchyme at 16.5 hpf (F). At 16.5 hpf, id2a is excluded from ectomesenchyme CNCCs marked by dlx2a (G) and twist1a (H), with twist1a also being expressed in head mesoderm. In sox10:Gal4VP16; UAS:Bmp4 embryos, id2a and sox10 are expressed ectopically in the ectomesenchyme (white arrows). Arrowheads indicate otic expression of sox10. Scale bars = 50 μm. EXPRESSION / LABELING:
|
|
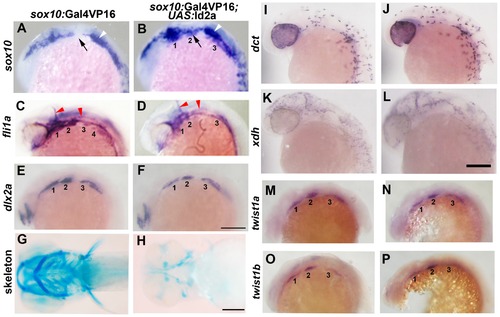
Forced expression of Id2a in CNCCs inhibits ectomesenchyme specification. (A–F) Whole mount in situs show ectopic arch expression of sox10 at 18 hpf in sox10:Gal4VP16; UAS:Id2a embryos (n = 7/7) but not sox10:Gal4VP16 only controls (n = 0/9), loss of fli1a arch expression at 24 hpf in sox10:Gal4VP16; UAS:Id2a embryos (n = 4/4) but not sox10:Gal4VP16 only controls (n = 0/17), and mild reductions of dlx2a arch expression at 18 hpf in sox10:Gal4VP16; UAS:Id2a embryos (n = 5/5) but not sox10:Gal4VP16 only controls (n = 0/8). Arches are numbered. Arrows denote the second arch, white arrowheads the developing ear, and red arrowheads the vasculature. (G and H) Skeletal staining at 5 dpf shows severe reduction of the craniofacial skeleton in sox10:Gal4VP16; UAS:Id2a embryos (n = 17/17) compared to sox10:Gal4VP16 only controls (n = 0/22). (I and J) In situs for dct expression at 28 hpf show that melanophore precursors are unaffected in sox10:Gal4VP16; UAS:Id2a embryos (n = 8) and sox10:Gal4VP16 only controls (n = 8). (K and L) In situs for xdh expression at 28 hpf show that xanthophore precursors are unaffected in sox10:Gal4VP16; UAS:Id2a embryos (n = 4) and sox10:Gal4VP16 only controls (n = 4). (M–P) twist1a expression at 18 hpf is unaffected in sox10:Gal4VP16; UAS:Id2a embryos (n = 12) versus sox10:Gal4VP16 only controls (n = 11). twist1b expression at 18 hpf is similarly unaffected in sox10:Gal4VP16; UAS:Id2a embryos (n = 7) versus sox10:Gal4VP16 controls (n = 8). Id2a misexpression embryos are to the right in I–P. Scale bars = 50 μm. EXPRESSION / LABELING:
PHENOTYPE:
|
|
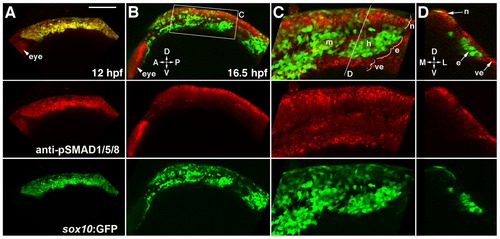
Bmp activity is selectively down-regulated in ectomesenchyme precursors. (A) Confocal projection of pSMAD1/5/8 immunostaining at 12 hpf shows that all sox10:GFP-positive CNCCs display high pSMAD1/5/8. (B–D) At 16.5 hpf, a projection (B) and a high-magnification section (C, boxed area in B) show that pSMAD1/5/8 remains high in the dorsal non-ectomesenchyme but is lower in the more ventral ectomesenchyme. An orthogonal section (D, taken at the level of the line in C) shows that high pSMAD1/5/8 CNCCs remain in the neural epithelium whereas low pSMAD1/5/8 CNCCs are positioned more medial and ventral. The eye also displays high pSMAD1/5/8. Abbreviations: D, dorsal; V, ventral; A, anterior; P, posterior; M, medial; L, lateral; m, mandibular arch ectomesenchyme; h, hyoid arch ectomesenchyme; n, non-ectomesenchyme; e, ectomesenchyme; ve, ventral epithelium. Scale bar = 50 μm. EXPRESSION / LABELING:
|
|
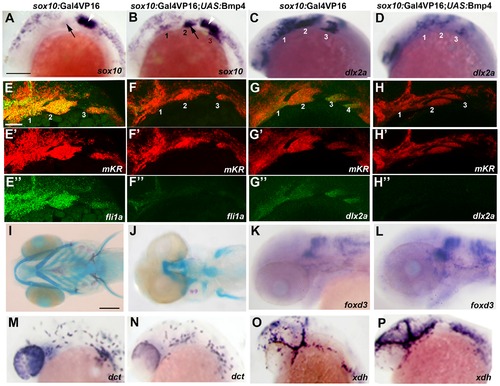
Misexpression of Bmp4 in migrating CNCCs inhibits ectomesenchyme formation. (A–D) Whole mount in situs at 18 hpf show ectopic expression of sox10 in the arches (numbered) of sox10:Gal4VP16; UAS:Bmp4; UAS:mKR embryos (n = 8/8) compared to sox10:Gal4VP16; UAS:mKR controls (n = 0/8) and reductions of dlx2a in sox10:Gal4VP16; UAS:Bmp4; UAS:mKR embryos (n = 4/4) compared to sox10:Gal4VP16; UAS:mKR controls (n = 0/4). Arrows indicate the second arch and white arrowheads the developing ear. (E–H) Double fluorescent in situs for mKR (red) and fli1a or dlx2a (green) at 24 hpf show reduction of fli1a arch expression in sox10:Gal4VP16; UAS:Bmp4; UAS:mKR embryos (n = 5/5) compared to sox10:Gal4VP16; UAS:mKR controls (n = 0/9) and reduction of dlx2a arch expression in sox10:Gal4VP16; UAS:Bmp4; UAS:mKR embryos (n = 4/4) compared to sox10:Gal4VP16; UAS:mKR controls (n = 0/3). The mKR transgene was included as a lineage tracer for CNCC-derived cells that migrated into the arches. (I,J) Skeletal staining at 5 dpf shows severe loss of craniofacial skeleton in sox10:Gal4VP16; UAS:Bmp4; UAS:mKR embryos (n = 7/7) compared to sox10:Gal4VP16; UAS:mKR controls (n = 0/9). (K,L) In situs for foxd3 at 48 hpf reveal largely normal patterns of glia in sox10:Gal4VP16; UAS:Bmp4; UAS:mKR embryos (n = 8) and sox10:Gal4VP16; UAS:mKR controls (n = 11). (M–P) In situs at 28 hpf show normal dct-positive melanophore precursors in sox10:Gal4VP16; UAS:Bmp4; UAS:mKR embryos (n = 12) and sox10:Gal4VP16; UAS:mKR controls (n = 15) and normal xdh-positive xanthophore precursors in sox10:Gal4VP16; UAS:Bmp4; UAS:mKR embryos (n = 10) and sox10:Gal4VP16; UAS:mKR controls (n = 10). Scale bars = 50 μm. EXPRESSION / LABELING:
PHENOTYPE:
|
|
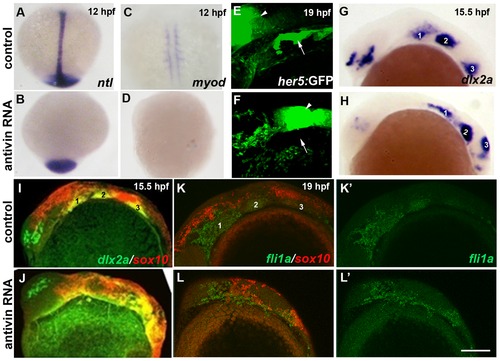
Mesoderm and endoderm are not essential for ectomesenchyme formation. (A–D) In situs at 12 hpf show loss of axial ntl and mesodermal myod expression in Antivin-mRNA-injected embryos compared to un-injected controls. (E,F) Confocal projections of her5:GFP expression at 19 hpf show loss of pouch endoderm (arrows) but not brain (arrowheads) in Antivin-mRNA-injected embryos compared to un-injected controls. (G,H) In situs at 15.5 hpf show normal ectomesenchyme induction of dlx2a in Antivin-mRNA-injected embryos (n = 12) and un-injected controls (n = 13). Arches are numbered. (I,J) Double fluorescent in situs at 15.5 hpf show normal induction of dlx2a (green) in sox10-positive CNCCs (red, yellow indicates co-localization) in Antivin-mRNA-injected embryos (n = 15) and un-injected controls (n = 9). (K,L) Double fluorescent in situs at 19 hpf show complementary expression of fli1a (green) in ectomesenchyme and sox10 (red) in non-ectomesenchyme in Antivin-mRNA-injected embryos (n = 5) and un-injected controls (n = 8). Scale bar = 50 μm. EXPRESSION / LABELING:
|
|
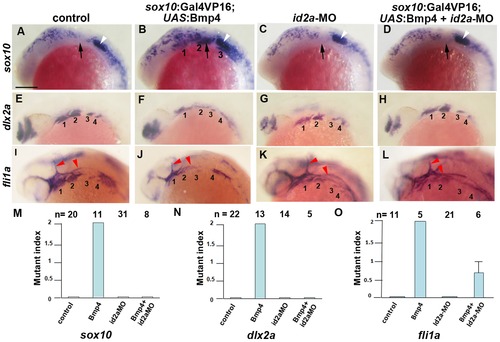
Reduction of Id2a rescues the ectomesenchyme defects caused by Bmp4 misexpression. (A–L) Colorimetric in situs show ectopic sox10 arch expression at 18 hpf and reductions of dlx2a and fli1a arch expression at 24 hpf in sox10:Gal4VP16; UAS:Bmp4 embryos but not sox10:Gal4VP16 control or id2a-MO-injected embryos. sox10:Gal4VP16; UAS:Bmp4 embryos injected with id2a-MO showed complete rescue of sox10 and dlx2a expression and partial rescue of fli1a expression. Arches are numbered and arrows denote the second arch, white arrowheads the developing ear, and red arrowheads the vasculature. Scale bar = 50 μm. (M–O) Quantification of gene expression defects. The mutant index is based on the following: 0 = normal, 1 = partially defective, 2 = fully defective. Fully defective was defined as gene expression being of equal intensity to that seen in un-injected sox10:Gal4VP16; UAS:Bmp4 embryos. For sox10, partially defective was defined as a reduction in the number of expressing cells and/or the intensity of arch expression compared to un-injected sox10:Gal4VP16; UAS:Bmp4 embryos. For fli1a and dlx2a, partially defective was defined as a level of arch expression intermediate between un-injected sox10:Gal4VP16; UAS:Bmp4 and sox10:Gal4VP16 control embryos. The rescue of Bmp4 misexpression defects with id2a-MO injection was statistically significant for all genes based on a Tukey-Kramer HSD test (α = 0.05). Standard errors of the mean are shown. EXPRESSION / LABELING:
|
|
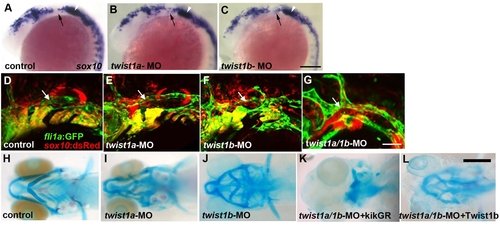
Twist1a and Twist1b function redundantly to specify ectomesenchyme. (A–C) In situs at 18 hpf show sox10 expression in un-injected, twist1a-MO, and twist1b-MO embryos. A few ectopic sox10-positive cells are seen in the second arches (arrows) of twist1a-MO and twist1b-MO embryos. White arrowheads denote the developing ear. (D–G) Confocal projections of fli1a:GFP; sox10:dsRed doubly transgenic embryos at 28 hpf show normal fli1a:GFP expression in un-injected control, twist1a-MO, and twist1b-MO embryos and loss of fli1a:GFP arch expression in twist1a/1b-MO embryos. Arrows indicate fli1a:GFP vascular expression which is unaffected in twist1a/1b-MO embryos. (H–L) Skeletal staining shows malformed mandibular and hyoid skeletons in twist1a-MO and twist1b-MO embryos compared to un-injected controls. In addition, co-injection of a Twist1b mRNA not targeted by the MOs partially rescued the head skeleton of twist1a/1b-MO embryos (n = 24/24), whereas co-injection of a control kikGR mRNA never rescued (n = 0/11). Scale bars = 50 μm. |
|
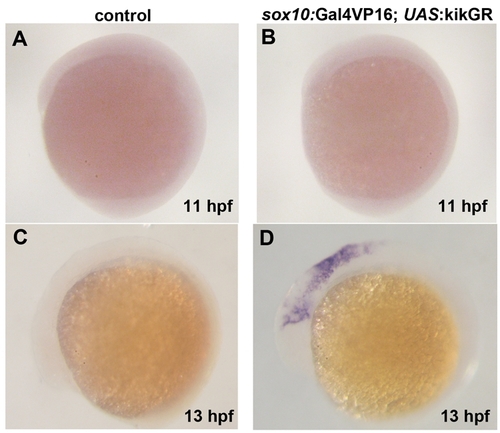
Time-course of sox10:Gal4VP16-dependent transgene expression. (A–D) In situs for kikGR mRNA in sox10:Gal4VP16; UAS:kikGR embryos show transgene expression in migratory CNCCs at 13 hpf but not in pre-migratory CNCCs at 11 hpf. sox10:Gal4VP16 control embryos show no expression. |
|
Cranial ganglionic neurons are unaffected in twist1a/1b-MO and Id2a misexpression embryos. (A–D) Confocal projections of anti-HuC/D immunofluorescence show neurons of the trigeminal (tg), anterior lateral line (all), otic (ot), and posterior lateral line (pll) ganglia at 36 hpf. No major differences in the pattern of anti-HuC/D staining was observed between uninjected control (n = 6), twist1a/1b-MO (n = 6), sox10:Gal4VP16 only control (n = 9), and sox10:Gal4VP16: UAS:Id2a (n = 8) embryos. Scale bar = 50 μm. |
|
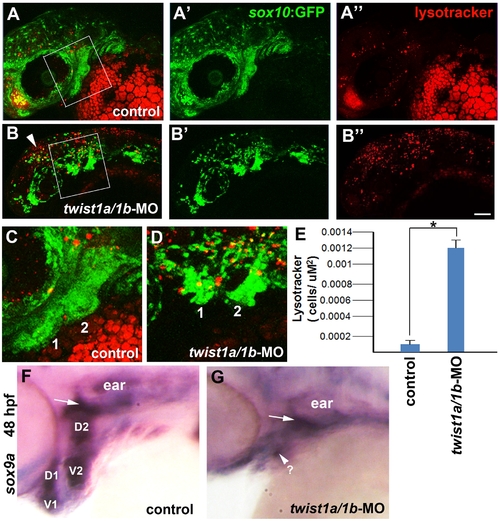
Cell death and sox9a expression in twist1a/1b-MO embryos. (A–D) Confocal projections of Lysotracker Red staining in 36 hpf sox10:GFP transgenic embryos show increased cell death in the pharyngeal arches (shown in high-magnification views in C and D from the boxes in A and B) in twist1a/1b-MO-injected embryos (n = 6) compared to un-injected controls (n = 6). Arrowhead shows increased cell death in more dorsal CNCCs as well. Scale bar = 50 μm. (E) Quantification of Lysotracker-positive cells per arch area. Mandibular and hyoid arches were used for the analysis. Asterisk indicates statistical significance using a Tukey-Kramer HSD test (α = 0.05). (F,G) In situ hybridizations for sox9a at 48 hpf show very reduced expression in the pharyngeal arches of twist1a/1b-MO embryos (n = 5/5) compared to uninjected controls (n = 0/12). Dorsal (D) and ventral (V) pre-chondrogenic domains of the mandibular (1) and hyoid (2) arches are shown for the control. sox9a expression in the pre-chondrogenic domain of the mesoderm-derived otic capsule cartilage (arrows) was less affected in twist1a/1b-MO embryos. |
|
Induction and early migration of CNCCs is unaffected by Bmp4 misexpression. In situs for sox10 at 15 hpf show no difference in early migrating CNCCs between sox10:Gal4VP16; UAS:Bmp4 embryos (n = 5) and sox10:Gal4VP16 only controls (n = 12). Scale bar = 50 μm. |
|
Cell death analysis in sox10:Gal4VP16; UAS:Bmp4 embryos. Compared to sox10:Gal4VP16 only controls (n = 8), Lysotracker staining reveals no major increase in cell death at 24 hpf in sox10:Gal4VP16; UAS:Bmp4 embryos (n = 8). Scale bar = 50 μm. |
|
Injection of twist1b mRNA fails to rescue sox10 ectomesenchyme persistence in Bmp4 misexpression embryos. (A–C) sox10 expression at 18 hpf was similarly upregulated in the arches of uninjected sox10:Gal4VP16; UAS:Bmp4 embryos (n = 11/11) and twist1b-mRNA-injected sox10:Gal4VP16; UAS:Bmp4 embryos (n = 5/5) compared to sox10:Gal4VP16 only controls (n = 0/10). Scale bar = 50 μm. |

