- Title
-
TIF1gamma controls erythroid cell fate by regulating transcription elongation
- Authors
- Bai, X., Kim, J., Yang, Z., Jurynec, M.J., Akie, T.E., Lee, J., LeBlanc, J., Sessa, A., Jiang, H., DiBiase, A., Zhou, Y., Grunwald, D.J., Lin, S., Cantor, A.B., Orkin, S.H., and Zon, L.I.
- Source
- Full text @ Cell
|
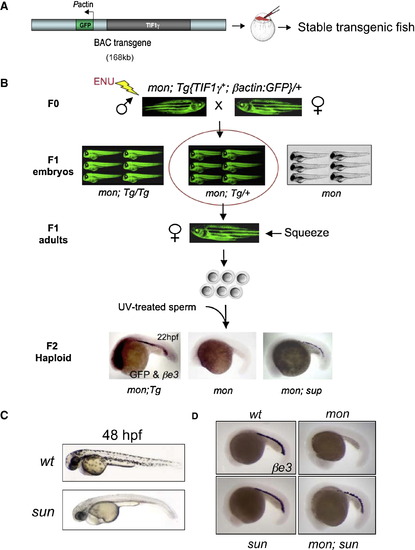
Genetic Suppressor Screen in the mon Mutant (A) Scheme of generating viable mon transgenic fish using a BAC transgene. (B) Scheme of the suppressor screen. BAC transgenic fish are green fluorescent. In F1 generation, three groups of embryos were obtained: transgene homozygous (mon; Tg/Tg), transgene heterozygous (mon; Tg/+), and embryos with no transgene (mon). Only transgene heterozygous (in the red circle) were raised up to adults. Double in situ hybridization of GFP and βe3 globin was performed on F2 haploid embryos. Note the GFP staining on mon; Tg haploids (strong in the head and weak throughout the body) but not on haploids lacking the transgene. “sup” indicates a suppressor mutation. (C) Morphology of the sunrise mutant at 48 hpf. (D) In situ hybridization of βe3 globin at 22 hpf. See also Figure S1. EXPRESSION / LABELING:
PHENOTYPE:
|
|
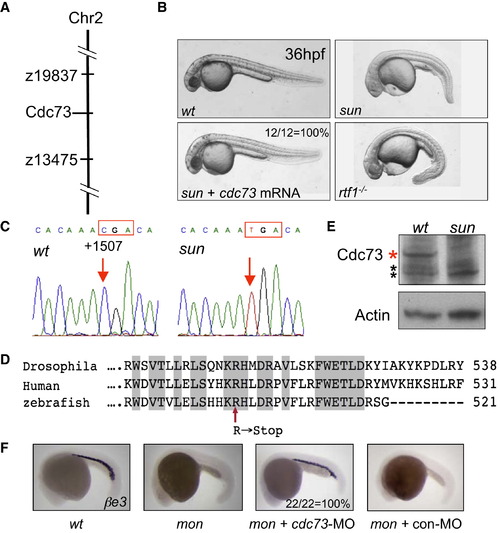
The Defective Gene in sunrise Is cdc73 (A) The sunrise locus was mapped on chromosome 2 between the microsatellite marker z19837 and z13475. The cdc73 gene is located within this region. (B) The morphology of wild-type, sun mutant, and rtf1-/- mutant at 36 hpf. Injection of cdc73 mRNA completely (12 out of 12 embryos) rescued the morphology of sun mutants. (C) DNA sequence chromatograms showing the C → T transition at +1507 in cdc73 coding region in sun homozygous mutant, leading to a premature stop codon (in the red box). (D) Alignment of the C-terminal CDC73 protein sequence from Drosophila, human, and zebrafish. The nonsense mutation in sun mutant is indicated by a red arrow. (E) Western blot showing the loss of CDC73 protein in sun mutant. Protein was extracted from 36 hpf embryos. Red asterisk: zebrafish CDC73 (∼64 kDa). Black asterisk: nonspecific bands. Actin is used as a loading control. (F) Morpholino (MO)-mediated knockdown of cdc73 completely rescues globin expression in mon (22 out of 22 embryos), whereas 5 bp mismatch control morpholino has no rescue (0 out of 13 embryos). EXPRESSION / LABELING:
PHENOTYPE:
|
|
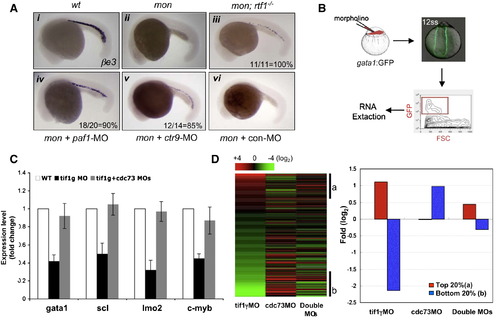
TIF1γ and PAF Antagonistically Regulate Erythroid Gene Expression (A) In situ hybridization of βe3 showing rescue of mon by depleting other PAF subunits. A 5 bp mismatch control morpholino for ctr9 was used in (vi). Rescue frequency (%) was shown in (iii–v). (B) Scheme of using gata1:GFP transgenic line to get RNA from erythroid cells in 12 ss zebrafish embryos. (C) Real-time RT-PCR analyses to compare the expression of blood genes in GFP+ cells between wild type and morphants. Results are shown as fold change relative to the wild-type control and normalized to expression of β-actin. The results presented as mean ± standard deviation (SD) from three independent experiments. (D) Microarray analysis to compare erythroid gene expression in gata1-GFP+ cells from morphants. Left: heat map of 243 erythroid signature genes. Right: a close-up look of average fold change of top 20% (a) and bottom 20% genes (b) from the heat map on the left. All microarray data have been deposited in the NCBI′s GEO database under the accession number GSE20432. See also Figure S2. EXPRESSION / LABELING:
PHENOTYPE:
|
|
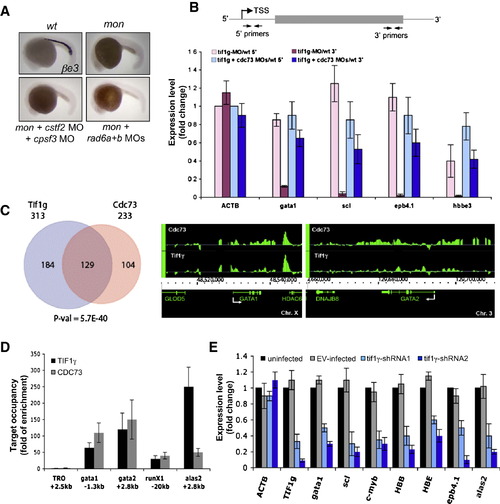
tif1γ Deficiency Reduces the Level of Full-Length Transcripts of Blood Genes (A) Morpholino knockdown of Rad6 and mRNA processing factors could not rescue βe3 globin expression in mon. In situ hybridization of βe3 globin was performed at 22 hpf. See also Figure S3. (B) Top: A schematic diagram showing the position of primers used in real-time RT-PCR analyses. Primers to detect the 5′ ends of transcripts are located within 120 bp from transcription start site (TSS), and primers for the 3′ ends of transcripts are in the 3′ coding region or 3′ untranslated region (UTR). Bottom: Real-time RT-PCR analyses to compare the level of 5′ (light pink and light blue) and 3′ (dark pink and dark blue) transcripts of selected genes between wild-type cells and morpholino knockdown cells. RNA was prepared as in Figure 3B. Results are shown as average fold change (mean ± SD) from three independent experiments, normalized to the level of the 5′ transcript of β-actin. (C) TIF1γ and CDC73 share common gene targets. Left: ChIP-Chip in K562 cells revealed a subset of gene targets shared between TIF1γ and CDC73. The significance of overlapping was evaluated by a hypergeometric distribution test. Right: ChIP-Chip at gata1 and gata2 locus. The transcription direction was indicated by white arrows. The raw dataset is available on NCBI′s GEO database under the accession number GSE20428. (D) TIF1γ and CDC73 ChIP in human CD34+ cells after 5 days of erythroid differentiation (proerythroblast stage). Results were normalized to the background level that was determined by ChIP without antibody. An inactive gene TRO (tropinin) was used as the negative control. The results are shown as mean ± SD from three independent experiments. (E) Real-time RT-PCR to compare erythroid gene expression between uninfected and infected CD34+ cells with indicated shRNA constructs. EV: empty vector. Data are represented as fold change relative to expression levels in uninfected cells. The results are shown as mean ± SD from three independent experiments. EXPRESSION / LABELING:
PHENOTYPE:
|
|
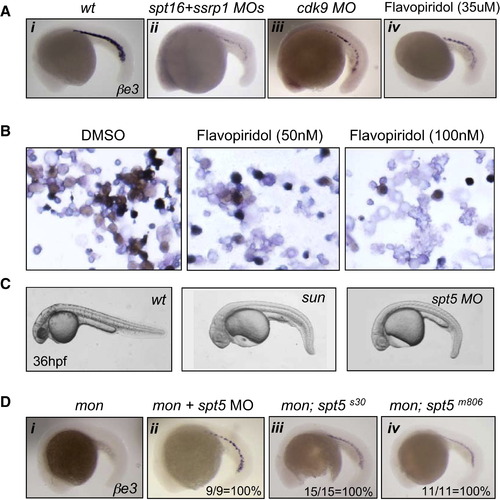
Effects of FACT, p-TEFb, and DSIF on Erythropoiesis (A) Reduced erythropoiesis by inhibiting FACT and p-TEFb. In situ hybridization of βe3 was performed on 22 hpf zebrafish embryos treated with morpholino injection (ii and iii) or 35 μM flavopiridol (iv). See also Figure S4. (B) Flavopiridol treatment blocks erythroid differentiation of human CD34+ cells. Cells were harvested at day 11 after differentiation (close to terminal differentiation stage), stained for benzidine (brown), and counterstained with May-Grunwald (blue). (C) Similar morphology of sun mutants and spt5 morphants at 36 hpf. (D) Rescue of mon mutants by spt5 morpholino and mutants, shown by in situ hybridization of βe3 globin at 22 hpf. Note the rescue efficiency was 100% in each case (ii–iv). EXPRESSION / LABELING:
PHENOTYPE:
|
|
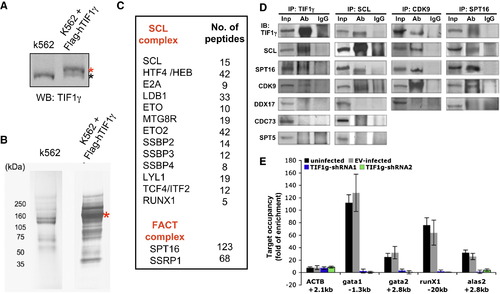
TIF1γ Is Required to Recruit Positive Elongation Factors to Erythroid Genes (A) The western blot showing the expression of Flag-tagged human TIF1γ in stably transfected K562 cells. Red asterisk: Flag-tagged h TIF1γ. Black asterisk: endogenous hTIF1γ. (B) Colloidal Coomassie blue staining showing proteins pulled down by anti-Flag antibody from untransfected K562 cells and cells stably expressing Flag-tagged TIF1γ. Flag-tagged TIF1γ is indicated by a red asterisk. (C) The factors from the SCL complex and the FACT complex identified in the MS analyses following anti-Flag pull down. The numbers of peptides were summarized from six independent experiments. See also Table S1. (D) K562 nuclear extracts were immunoprecipitated (IP) and subsequently immunoblotted (IB) with indicated antibodies. Corresponding IgG was used as the negative control. Note CDC73 and SPT5 do not co-IP with TIF1γ or SCL. DDX17 was used as a negative control to show the specificity of co-IP experiments. See also Figure S5. (E) CDK9 ChIP in human CD34+ cells infected with empty vector (EV) or tif1γ-shRNAs. Cells were harvested after 5 days of erythroid differentiation (proerythroblast stage). Results are shown as fold enrichment compared to the background level that is determined by no-antibody ChIP. The results are shown as mean ± SD from two independent experiments. |
|
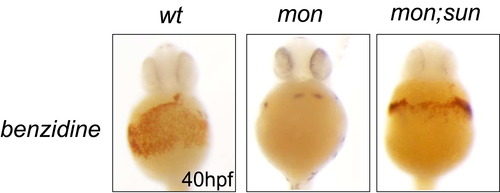
Rescue of Hemoglobin in mon; sun Double Mutants, Related to Figure 1 Benzidine staining was performed at 40 hpf. |
|
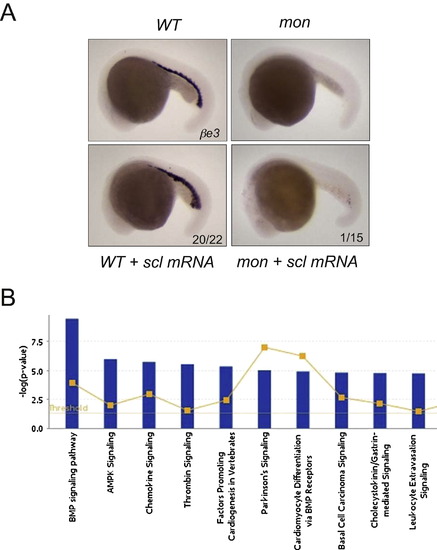
Related to Figure 3 (A) Scl overexpression enhanced blood formation in wild-type embryos but showed little rescue of mon mutants. In situ hybridization of βe3 globin was performed at 22 hpf. (B) Ingenuity Pathway Analysis of top 200 genes that were oppositely regulated by TIF1γ deficiency and PAF deficiency. |
|
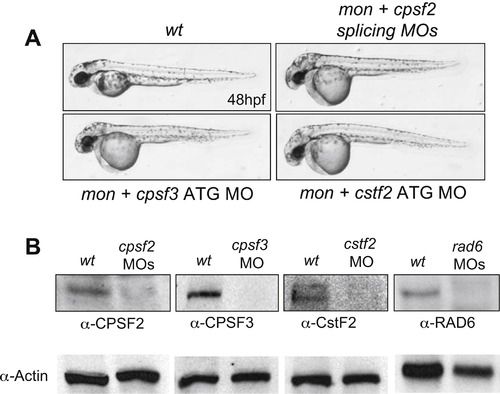
The Efficiency of Morpholino Knockdowns, Related to Figure 4 (A) Knockdown of CPSF and CstF factors cause similar morphology at 48 hpf. (B) The western blots showing knockdown efficiency of CPSF factors and Rad6. |
|
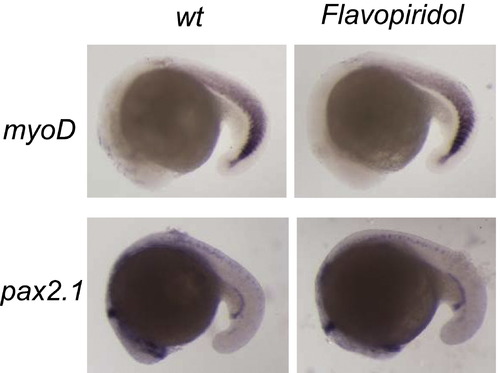
Flavopiridol Treatment Does Not Affect Mesoderm Genes myoD and pax2.1, Related to Figure 5 In situ hybridization was performed at 20 hpf. |
|
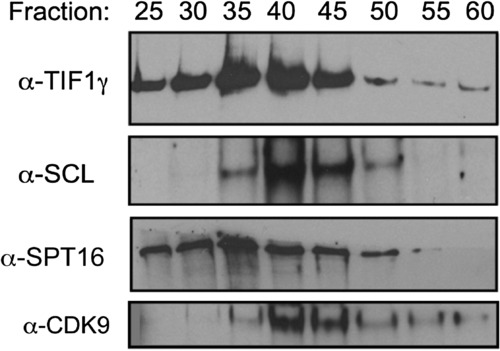
Gel-Filtration and Western Blot Analyses Showing Coelution of TIF1γ, SCL, CDK9, and SPT16 in K562 Cells, Related to Figure 6 |
Reprinted from Cell, 142(1), Bai, X., Kim, J., Yang, Z., Jurynec, M.J., Akie, T.E., Lee, J., LeBlanc, J., Sessa, A., Jiang, H., DiBiase, A., Zhou, Y., Grunwald, D.J., Lin, S., Cantor, A.B., Orkin, S.H., and Zon, L.I., TIF1gamma controls erythroid cell fate by regulating transcription elongation, 133-143, Copyright (2010) with permission from Elsevier. Full text @ Cell

