- Title
-
Microarray analysis of zebrafish cloche mutant using amplified cDNA and identification of potential downstream target genes
- Authors
- Qian, F., Zhen, F., Ong, C., Jin, S.W., Meng Soo, H., Stainier, D.Y., Lin, S., Peng, J., and Wen, Z.
- Source
- Full text @ Dev. Dyn.
|
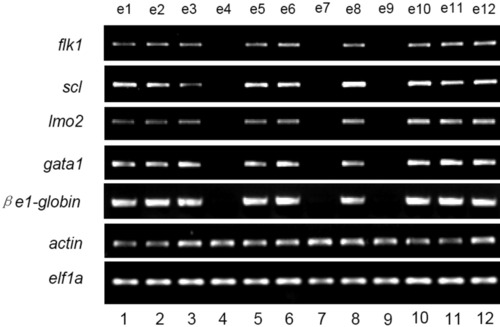
Genotyping of the 18-somite clo homozygous and wild-type/heterozygous sibling embryos by semiquantitative reverse transcriptase-polymerase chain reaction (RT-PCR). Equal amount (1/10) of cDNA from the randomly selected single 18-somite embryo was subjected to semiquantitative PCR analysis with specific primers for zebrafish flk1, scl, lmo2, gata1, and e1-globin. actin and elf1a were used as control to indicate the amount of cDNA used. Lanes 4, 7, and 9 are clo mutants, whereas the other lanes (lanes 1, 2, 3, 5, 6, 8, 10, 11, and 12) represent wild-type or heterozygous sibling embryos. EXPRESSION / LABELING:
|
|
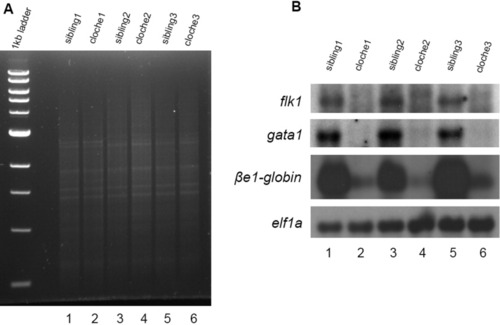
Analysis of amplified cDNA quality. A: DNA electrophoresis analysis. A total of 100 ng of each amplified cDNAs derived from the single 18-somite clo homozygous mutant (lanes 2, 4, and 6) and wild-type or heterozygous sibling embryos (lanes 1, 3 and 5) was separated on 1% agarose gel. Ethidium bromide staining shows an evenly distributed smear of DNA in each lane. B: Virtual Northern analysis. cDNAs of A were transferred to a Hybone-N+ membrane and probed with digoxigenin-labeled flk1, gata1, e1-globin and actin. Whereas elf1a transcript was maintained at a similar level in all the samples, expression of flk1, gata1, and e1-globin were either absent or drastically reduced in the clo mutant embryos (lanes 2, 4, and 6). EXPRESSION / LABELING:
|
|
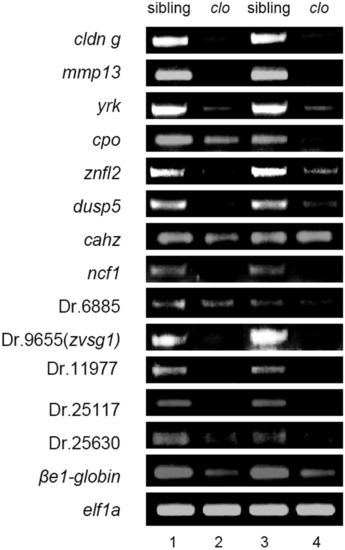
Verification of target clones by semiquantitative reverse transcriptase-polymerase chain reaction (RT-PCR). One microgram of total RNA sample (20 embryos each) derived from the wild-type sibling (lanes 1 and 3) and clo mutant embryos (lanes 2 and 4) were reverse transcribed and subjected to PCR analysis with specific primers corresponding to each of the perspective target genes. PCR products were electrophoresed on 1% agarose gel and stained with ethidium bromide. e1-globin and elf1a were used as internal controls. EXPRESSION / LABELING:
|
|
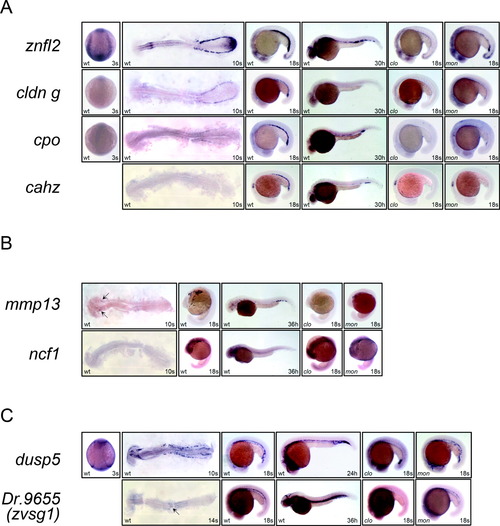
Temporal and spatial expression of znfl2, cldn g, cpo, cahz, mmp13, ncf1, dusp5, and zvsg1. A: Whole-mount in situ hybridization shows that znfl2 (top panels), cldn g (second panels), cpo (third panels), and cahz (bottom panels) are expressed in erythrocytes. B: Whole-mount in situ hybridization indicates that mmp13 (upper panels) and ncf1 (lower panels) stain myeloid lineage cells. C: Whole-mount in situ hybridization shows that dusp5 (upper panels) and zvsg1 (lower panels) express in the head and trunk vessels. The 3-, 10- and 14-somite stage embryos are dorsal view (3s) and flat-mount in dorsal view (10s and 14s), whereas rests of the embryos are lateral view. In all the panels, the 3-somite stage embryos are oriented anterior to the top and the rest are oriented anterior to the left. EXPRESSION / LABELING:
|


