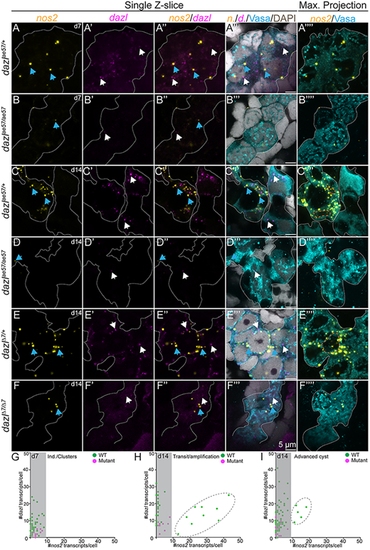
Absence of germline stem cells in dazl mutants. (A-F⁗) Single confocal plane of representative dazl+/+ or dazlae57/ae57 gonads at 7 days (individuals/clustered cells) and 14 days (transition/amplification), and dazl+/+ or dazlΔ7Δ7(advanced cyst) at 14 days labeled with nanos2 (yellow) or dazl (magenta) RNA probes, Vasa (cyan) and DAPI (gray). Sagittal view (XY) (left side) or maximum projection (right side) of 5-10 planes of a z-stack. (A-A⁗) Early nanos2 (blue arrows) and dazl (white arrows) foci in individuals/clustered cells in dazl+/+ at 7 days. (B-B⁗) Expression of nanos2 and dazl in individuals/clustered cells in dazlae57/ae57 at 7 days. (C-C⁗) Presence of abundant nanos2 foci during transition/amplification (orange dotted line surrounding the nuclear envelope). All GCs express dazl RNA. (D-D⁗) Scattered nanos2 and dazl foci in dazlae57/ae57 mutant cells that failed to progress beyond transition/amplification at day 14. (E-E⁗) Germline cysts in dazl+/+ with two populations: nanos2+ low-expressing cells (cells without an orange dashed line) and nanos2+ high-expressing cells (cells with an orange dotted line). (F-F⁗) nanos2 (blue arrows) foci in dazlΔ7Δ7 cells. (G) Quantification of nanos2 foci/cell compared with dazl foci/cell at 7 days (clustered stage). (H) Quantification of nanos2 foci/cell compared with dazl foci/cell at 14 days (transition/amplification stage). Dark gray dashed line encircles the nanos2+ high population. (I) Quantification of nanos2 foci/cell compared with dazl foci/cell at 14 days (advanced cyst stage). Dark gray dashed line encircles the nanos2+ high population. Gonads analyzed: 7 days, dazl+/+, n=5 (A-A⁗); 7 days, dazlae57/ae57, n=2 (B-B⁗); 14 days, dazl+/+ n=3 (C-C⁗); 14 days, dazlae57/ae57 n=2 (D-D⁗); 14 days, dazl+/+, n=4 (E-E⁗); 14 days, dazlΔ7Δ7, n=2 (F-F⁗).
|
