
FIGURE
Fig. 3
- ID
- ZDB-FIG-231018-3
- Publication
- Hu et al., 2023 - Single-cell transcriptome profiling reveals diverse immune cell populations and their responses to viral infection in the spleen of zebrafish
- Other Figures
- All Figure Page
- Back to All Figure Page
Fig. 3
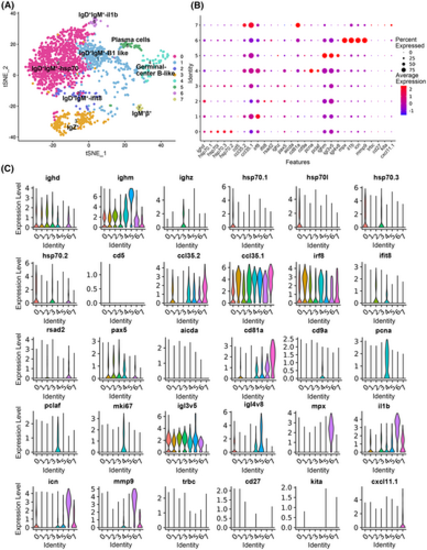
B-cell subtype analysis based on single-cell gene expression. (A) Graph-based clustering of B cells showing eight subclusters. (B) Dotplots showing the expression of selected genes across cell clusters. The size of the dot reflects the percentage of cells within a class expressing the gene, while the color intensity indicates the average expression level of “expressing” cells. (C) Violin plots of eight clusters of B-cell population molecular markers. The title of each subimage is the name of the marker gene. |
Expression Data
Expression Detail
Antibody Labeling
Phenotype Data
Phenotype Detail
Acknowledgments
This image is the copyrighted work of the attributed author or publisher, and
ZFIN has permission only to display this image to its users.
Additional permissions should be obtained from the applicable author or publisher of the image.
Full text @ FASEB J.