
Fig. 2
- ID
- ZDB-FIG-231018-2
- Publication
- Hu et al., 2023 - Single-cell transcriptome profiling reveals diverse immune cell populations and their responses to viral infection in the spleen of zebrafish
- Other Figures
- All Figure Page
- Back to All Figure Page
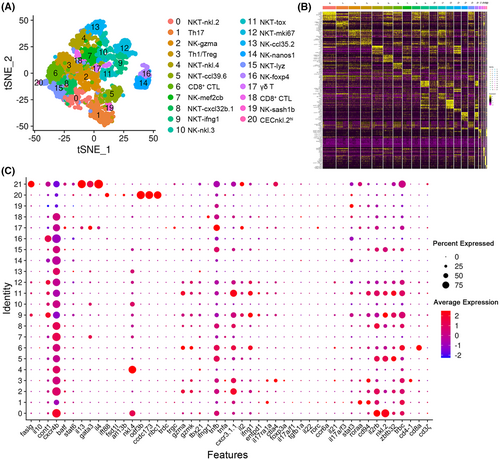
T/NK-cell subtype analysis based on single-cell gene expression. (A) Graph-based clustering of T/NK cells showing the 21 subclusters in the control group. tSNE nonlinear clustering was used to visualize the different classification results of T/NK-cell populations in zebrafish spleen. (B) Heatmap of marker genes from each cluster. Each column in the figure represents a cell subtype, and each row represents a gene. The expression levels of genes in different cells are indicated by different colors. (C) Dotplots showing the expression levels of marker genes and percentages of cells per cluster that express the gene of interest. |